Real Estate Information Archive

Blog

Displaying blog entries 61-70 of 240

RE/MAX National Housing Report for March 2019

by Elite Asset Management Team

March Sales Signal Slowest Start to Spring Homebuying Since 2014


DENVER – Kicking off the spring homebuying season, March sales climbed almost 29% over February, according to the RE/MAX National Housing Report. But this remains the slowest start in five years, with March sales 8.6% lower than March 2018.
 
March was the eighth consecutive month of year-over-year sales declines and the sixth straight month of year-over-year inventory growth, with a 5.3% gain. Housing activity in the report’s 54 markets nationwide also saw the Median Sales price grow by 3.4% year-over-year – notably smaller than the year-over-year increases in February (5.5%) and January (4.6%).  However, the median sales price has risen by more than 3% year-over-year in 17 of the last 18 months.
 
From 2015 to 2018, the housing market’s spring sprang to life with an increase in sales from February to March averaging 37.0%. March 2019’s month-over-month increase of 28.8% was the smallest since 24.6% in 2014.
 
Days on Market increased to 59 from 57 last March, while Months Supply of Inventory declined year-over-year to 2.7 from 3.0.
 
“It was encouraging to see month-over-month sales improve during March,” said RE/MAX CEO Adam Contos. “Although the seasonal bounce that typically ends the first quarter wasn’t as strong as in the past few years, conditions are in place for a healthy spring selling season. Falling interest rates, rising inventory and moderating price increases against the backdrop of a healthy overall economy are cause for optimism for buyers and sellers alike.”
 
Closed Transactions 
Of the 54 metro areas surveyed in March 2019, the overall average number of home sales is up
28.8% compared to February 2019, and down 8.6% compared to March 2018. Leading the month-over-month sales percentage increase were Burlington, VT, at +48.3%, Wichita, KS, at +46.8%, and San Francisco, CA, at +44.3%.
 
Median Sales Price – Median of 54 metro median prices
In March 2019, the median of all 54 metro Median Sales Prices was $246,000, up 2.5% from February 2019, and up 3.4% from March 2018. Two metro areas saw a year-over-year decrease in Median Sales Price:  San Francisco, CA, at -3.8% and Hartford, CT, at -1.4%. Three metro areas increased year-over-year by double-digit percentages – Manchester, NH, at +12.2%, Omaha, NE, at +11.8%, and Wichita, KS, at +10.7%.
 
Days on Market – Average of 54 metro areas
The average Days on Market for homes sold in March 2019 was 59, down three days from the average in February 2019, and up two days from the March 2018 average. The metro areas with the lowest Days on Market were Omaha, NE, and San Francisco, CA, both at 31, and Denver, CO, at 35. The highest Days on Market averages were in Augusta, ME, at 122, and Burlington, VT, and Hartford, CT, both at 97. Days on Market is the number of days between when a home is first listed in an MLS and a sales contract is signed.
 
Months Supply of Inventory – Average of 54 metro areas
The number of homes for sale in March 2019 was up 0.3% from February 2019 and up 5.3% from March 2018. Based on the rate of home sales in March 2019, the Months Supply of Inventory decreased to 2.7 from 3.7 in February 2019, and from 3.0 in March 2018. A six-months supply indicates a market balanced equally between buyers and sellers. In March 2019, of the 54 metro areas surveyed, only Miami, FL, at 6.5 reported a supply at or over six months, which is typically considered a buyer’s market. The markets with the lowest Months Supply of Inventory were Denver, CO, at 1.2, and four metros at 1.3 – San Francisco, CA, Seattle, WA, Boise, ID, and Manchester, NH.


Feel free to contact me and I can help break down exactly what these numbers mean for our local market and for your neighborhood. And lastly, If you or anyone you know is thinking of buying or selling a home - please call or email me. I'm here to help!

Peter Veres

Associate Broker,CRS,ABR,CLHMS,SRES

Elite Asset Management Team - RE/MAX Elite

www.PeteVeres.com

Cell: 505-362-2005


Data Says April Is The Best Month To List Your Home For Sale

by Elite Asset Management Team


The spring housing market is off to the races! The inventory of homes for sale is increasing, buyers are out in force, and interest rates have remained low, peaking the interest of buyers and sellers previously on the fence about making a move.

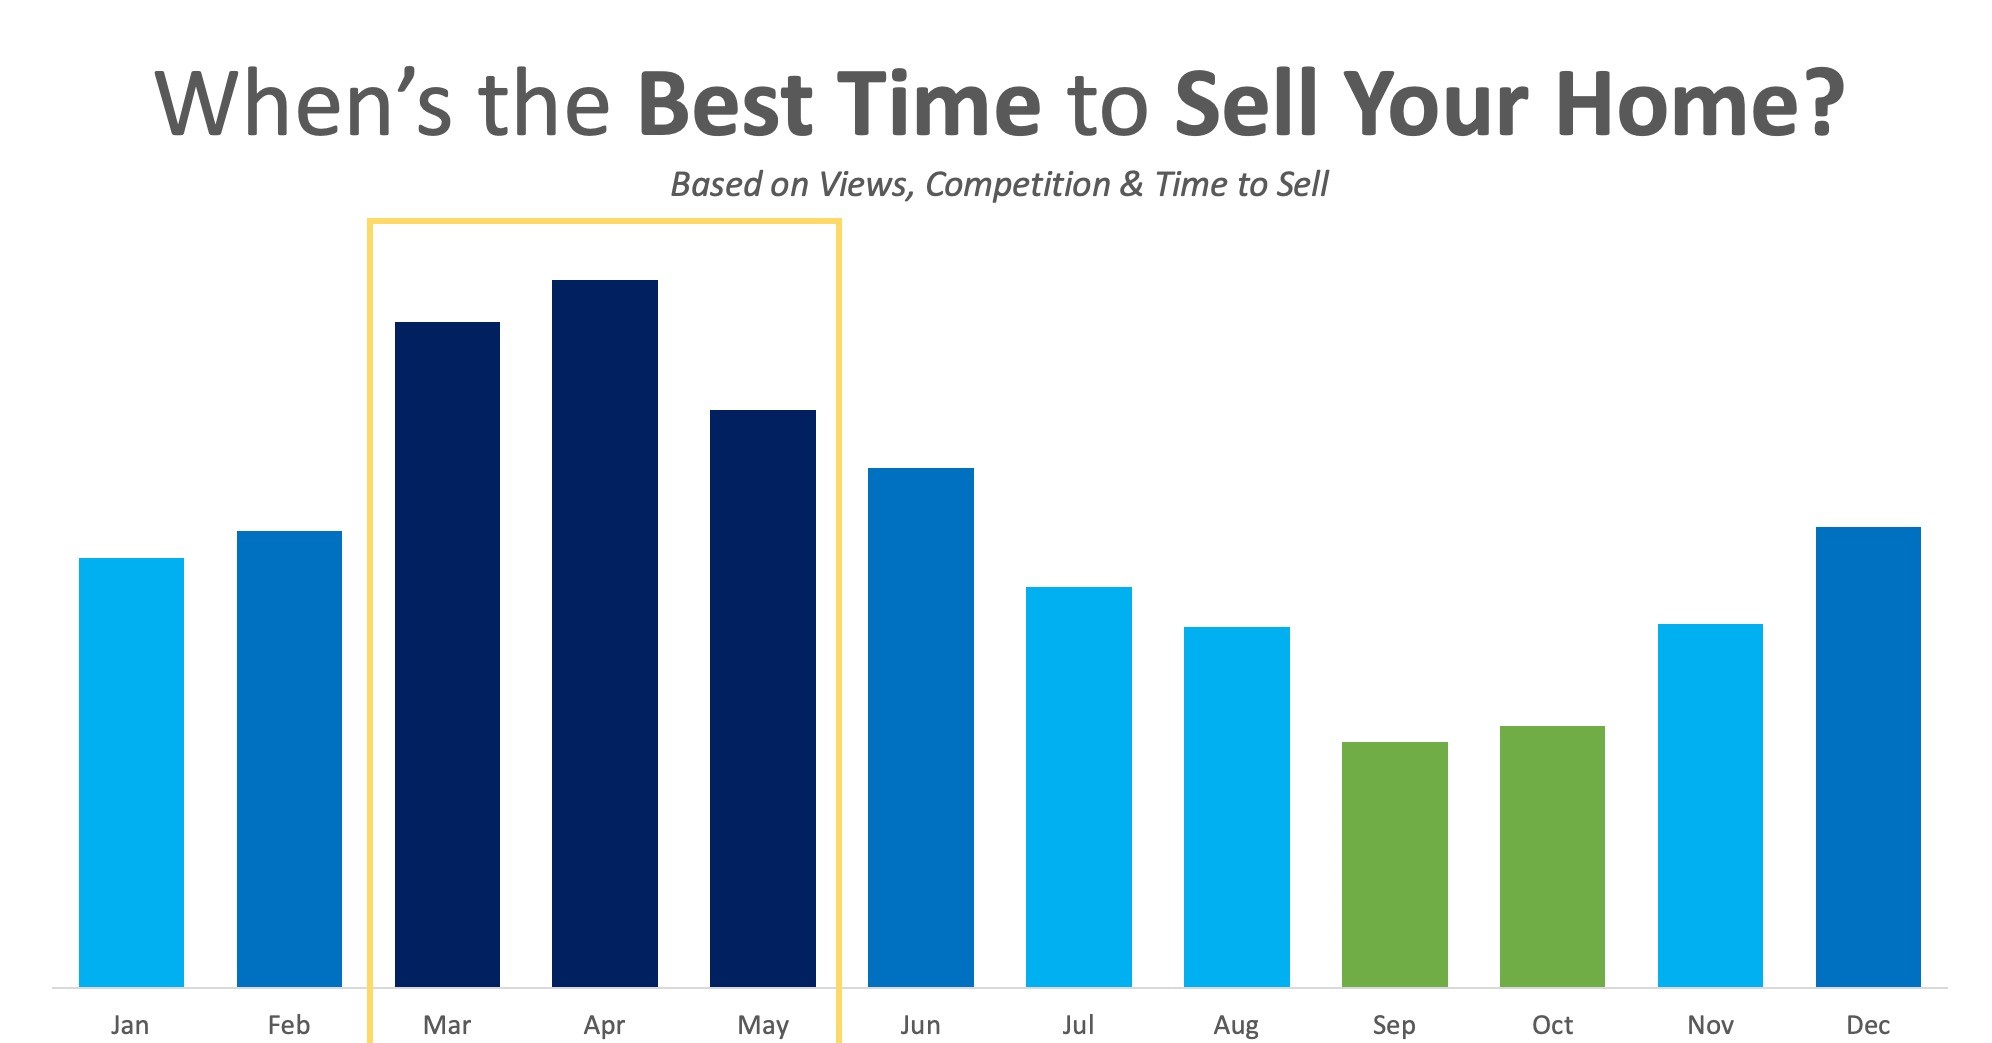
New research from realtor.com shows that the first week of April is actually the best time to list your house for sale! The report used “trends in median listing prices, views per property on realtor.com, home price drops, median days on market, and number of listings on the market over the last three years,” to determine a ranking for every week of the year.

Listing your home in the first week of April contributes 14x more property views, 5% less competition from other home sellers, and results in the home being sold 6 days faster!

Below is a graph indicating the average score for each month of the year.


It should come as no surprise that April and May dominate as the top months to sell. The second quarter of the year (April, May, June) is referred to as the Spring Buyers Season, when competition is fierce to find a dream home, often leading to bidding wars.

However, there is one caveat worth mentioning. When broken down by metro, realtor.com noticed that while warmer climates share an overall trend, they have different top sales months. The best month to get the most exposure in Miami, FL, for instance, is August, while in Phoenix, AZ, June leads the charge.

If you’re thinking of selling your home this year, the time to list is NOW! According to the National Association of Realtors, 41% of homes sold last month were on the market for less than 30 days! If you list now, you’ll have a really good chance to sell in April or May, setting yourself up for the most exposure!


Bottom Line

Contact a local real estate professional who can show you the market conditions in your area to get the most exposure to the buyers ready and willing to make a move!

Meet with a realtor like Pete Veres, CRS – Certified Residential Specialist & ABR – Accredited Buyers and Seller Representative who can help you navigate thru the process and get the job done for you. He can provide you with a Free Market analysis when you are ready. Pete Veres has had over 25 years of Sales & Marketing experience, excellent negotiating skills and a superb track record.

You can contact him by calling or texting him at 505-362-2005 or by emailing him at [email protected].

He has a great website full of the latest information at www.NMElite.com

Here are also some Free Sellers resources. VIP-Seller-Resources

Do 46 Million Millennials Know They Are Mortgage Ready?

by Elite Asset Management Team


Many have written about the millennial generation and whether or not they, as a whole, believe in homeownership as part of attaining the American Dream.

Millennials have taken longer to obtain traditional milestones than the generations before them, such as getting married, having kids, and buying a home. However, that does not mean that they do not still aspire to achieve those things.

History shows that people tend to buy their first home around age 30. Nearly 5 million millennials will turn 30 in the next two years. This will continue to fuel demand for housing.

This is also one of the many reasons why the millennial homeownership rate has continued to grow over the past few years. 48.4% of Americans between the ages of 30-34 now own a home.

There are over 46 million millennials (33% of the generation) who are considered “Mortgage Ready”,meaning they meet the qualifications to be approved for a mortgage today!


  • a FICO Score ≥ 620
  • a Back-End Debt to Income Ratio ≤ 25%
  • no Foreclosures or Bankruptcies in the last 7 years
  • no severe delinquencies in 1 year


Rob Chrane, CEO of Down Payment Resource, commented on the findings of the report,


“We now know there are millions of buyers with the income & credit necessary to qualify to buy a home. The biggest question is:

Do they know it? …Unfortunately, many renters don’t investigate homeownership simply because they don’t believe it’s an option.”

The good news is that more and more millennials are realizing that they can afford a home now. Even so, more can be done to increase awareness of low down payment programs to attract even more of this generation.

New data from realtor.com shows that in December, millennials accounted for 42% of all new home loans originated in the month. This is more than any other generation.


Bottom Line 

If you are one of the many millennials who may be “Mortgage Ready” but are unsure what your next steps should be, contact a local real estate professional who can help guide you on your path to homeownership.


Meet with a realtor like Pete Veres, CRS – Certified Residential Specialist & ABR – Accredited Buyers Representative who can help you navigate thru the process and get the job done for you. Pete Veres has had over 25 years of Sales & Marketing experience, excellent negotiating skills and a superb track record.

You can contact him by calling or texting him at 505-362-2005 or by emailing him at [email protected].

He has a great website full of the latest information at www.NMElite.com


RE/MAX National Housing Report for February 2019

by Elite Asset Management Team


Declining Sales, Growing Inventory Continue to Move in Direction of Buyer’s Market


DENVER – Riding two trends—declining sales and growing inventory— the U.S. housing market continued to transition from a seller’s market to a buyer’s market in February, according to the RE/MAX National Housing Report.
 
Home sales in the 54-market report have declined year-over-year for seven consecutive months, though February’s downturn of 4.2% was the smallest since the 1.1% drop that started the streak in August 2018. At the same time, inventory grew 5.8% over February of 2018, marking the fifth consecutive month of growth following a decade-long trend of shrinking inventory. The Months Supply of Inventory also grew in February from 3.1 in 2018 to 3.4 this year.
 
Bucking these trends, the Median Sales Price increased to $240,000, a year-over-year gain of 5.5% and a February record in the 10-year history of the report. That followed January’s upturn of 4.6%.
 
Days on Market totaled 63—one day more than February 2018 and four days more than January 2019.
 
“Trends of five months or more often indicate significant shifts, and the year-over-year trends in declining sales and rising inventory have both reached that length now,” said RE/MAX CEO Adam Contos. “It’s interesting to see the slowing sales and growing inventories that benefit buyers and at the same time the record prices that benefit sellers. The big picture supports an ongoing return to more balanced conditions.”  
 
“The next few months will determine whether the shift brings a wave of buyers into the market for the spring selling season. Members of our network are reporting high local demand along with a need for even more inventory. The optimism for a solid spring exists – and a more balanced market certainly contributes to it.”
 
Closed Transactions
Of the 54 metro areas surveyed in February 2019, the overall average number of home sales is up
10.2% compared to January 2019, and down 4.2% compared to February 2018. Leading the month-over-month sales percentage increase were Houston, TX at +28.8%, Birmingham, AL at +26.7%, and Raleigh-Durham, NC at 26.5%.
 
Median Sales Price – Median of 54 metro median prices
In February 2019, the median of all 54 metro Median Sales Prices was $240,000, up 2.2% from January 2019, and up 5.5% from February 2018. Nine metro areas saw a year-over-year decrease in Median Sales Price including Birmingham, AL at -4.2%, Hartford, CT at -4.0%, and Anchorage, AK at -3.9%. Four metro areas increased year-over-year by double-digit percentages, with the largest increases seen in Boise, ID at +16.0%, Cincinnati, OH at +13.2%, and Wilmington/Dover, DE at +12.6%.
 
Days on Market – Average of 54 metro areas
The average Days on Market for homes sold in February 2019 was 63, up four days from the average in January 2019, and up 1 day from the February 2018 average. The metro areas with the lowest Days on Market were Omaha, NE at 34, San Francisco, CA at 37, and a two-way tie between Denver, CO and San Diego, CA at 42. The highest Days on Market averages were in Augusta, ME at 120, Trenton, NJ at 113, and Hartford, CT at 96. Days on Market is the number of days between when a home is first listed in an MLS and a sales contract is signed.
 
Months Supply of Inventory – Average of 54 metro areas
The number of homes for sale in February 2019 was down 1.4% from January 2019 and up 5.8% from February 2018. Based on the rate of home sales in February 2019, the Months Supply of Inventory decreased to 3.4 from 3.9 in January 2019, and increased compared to 3.1 in February 2018. A six months supply indicates a market balanced equally between buyers and sellers. In February 2019, five of the 54 metro areas surveyed reported a months supply at or over six months, including Miami, FL at 7.6 and Indianapolis, IN at 7.4, which is typically considered a buyer’s market. The markets with the lowest Months Supply of Inventory were Denver, CO at 1.4 and San Francisco, CA at 1.6.


Feel free to contact me and I can help break down exactly what these numbers mean for our local market and for your neighborhood. And lastly, If you or anyone you know is thinking of buying or selling a home - please call or email me. I'm here to help!


Peter Veres

Associate Broker,CRS,ABR,CLHMS,SRES

Elite Asset Management Team - RE/MAX Elite

www.PeteVeres.com

Cell: 505-362-2005

RE MAX vs The Industry 2018

by Elite Asset Management Team

Portable Storage – The Key to Successful Home Staging

by Elite Asset Management Team


Do your clients want to sell their houses as fast as they can for as much as they can? Realtors

and home staging experts agree: staging their home should be at the top of your client's

checklist. A big part of this process entails removing excess items and furniture. The inevitable

question becomes, “Where do my clients put their stuff?”

It’s tempting to stuff everything you own into a closet or a spare bedroom, but even a single

unorganized space could turn off buyers. For many years, the common solution to this problem

was renting a storage unit. This was not convenient, and definitely time-consuming. Home

sellers had to rent a truck, load it, unload it, and then subsequently do it all over again

when they moved to a new place.

Fortunately, there’s a better option. With a PODS portable storage & moving solution, a driver

will drop off a storage container at your client's house, and they can load it at their leisure,

without the added pressure of having to get a truck back by the end of the day.

Driving is included

Once they have loaded the container, it will get picked up and driven to a storage facility by

PODS. When they are ready for their container again, it will be dropped off at their

convenience. This means they only have to load and unload once without worrying about

renting a truck or borrowing one.

Built-in flexibility

While they're staging their home, they might want to try different furniture arrangements or add

or remove items. A portable container is convenient because of the flexibility. They can either

easily access their container in a nearby storage center, or their container can be dropped off

at their property if they need to add or retrieve items.

Most realtors recommend keeping the container at a storage facility, so your client's property

will look tidier and more spacious. This also allows potential buyers to envision themselves

more easily in their home.

Storage plus moving

If your client is moving out-of-state or long-distance, PODS can move their container to their

residence. PODS services 46 states and can even move containers to and from Hawaii and

across the Canadian border. This means your clients can store and move with one solution,

which can be very convenient to sellers.

Selling a home and moving is a stressful proposition in any circumstance. Portable storage is a

good solution to help your clients ease the burden. It also allows them to take care of two

hassles at once, storing their items and then moving them to their next home when they’re

ready.

Visit PODS.com/Remax or call (866) 556-9595 and mention Promo Code: RMAX

What Are The Benefits Of Becoming A Homeowner?

by Elite Asset Management Team


Every family has a list of important dates. We celebrate birthdays, anniversaries, pet adoptions…and the list goes on. For 64.4 percent of households in the United States, this list includes the day they became a homeowner for the first time!

Why is this date important? Homeownership is not just a roof over your head! It represents shelter, stability, wealth, and pride! For decades, homeownership has been an important part of the American Dream!

However, many question if the next generations see the same benefits of homeownership as their predecessors.

In case we have forgotten, some of those benefits are:

Non-Financial Benefits

  1. Educational Achievement: Homeownership has a positive impact on academic achievement, including reading and math performance in children 3-12 years old.
  2. Civic Participation: “Owning a home means owning a part of the neighborhood.” Homeowners have a stronger connection to their neighborhood and are more committed to volunteer.
  3. Health Benefits: Adjusting for a range of demographic, socioeconomic and housing-related characteristics, homeowners have a substantial health advantage over renters.
  4. Public Assistance: The report shows 47% of homeowners use their home equity credit lines to help pay other debts, diminishing their need for public assistance.
  5. Property Maintenance and Improvement: A well-maintained home not only generates benefits through consumption and safety, but a high-quality structure also raises mental health.
  6. Pride of Ownership: This place is uniquely “yours.” You can customize it according to your likes and personality.

In addition to financial benefits, homeownership also brings significant social benefits. These not only pertain to the family, but extend to the communities, the state, and the country!

Financial Benefits

Buying a home is an investment in your future!

  1. Appreciation: On average, home prices are appreciating annually at a rate of 3.6%. This helps to create a safety net.
  2. Forced Savings: Your mortgage is like a forced savings plan! With each payment, you are reducing the principal of your loan.
  3. Home Equity: Homeownership builds equity every single month. You can later use that equity to start a business, send your children to college, etc.
  4. Net Worth: A homeowners’ net worth is 44x greater than renters! This gives you the financial freedom to invest.
  5. Stability: Rent prices increase 4% annually! A fixed mortgage payment allows you to save for future projects and guard against inflation.
  6. Tax Benefits: The government has created tax benefits to encourage customers to purchase. (Talk to your CPA to see which benefits apply to you).

Bottom Line

Homeownership is and will always be part of the American Dream! There are many financial and non-financial benefits to take advantage of when owning a home. If owning a home is part of your dream, contact a local real estate professional to help you with the process!


Meet with a realtor like Pete Veres, CRS – Certified Residential Specialist & ABR – Accredited Buyers Representative who can help you navigate thru the process and get the job done for you. Pete Veres has had over 25 years of Sales & Marketing experience, excellent negotiating skills and a superb track record.

You can contact him by calling or texting him at 505-362-2005 or by emailing him at [email protected].

He has a great website full of the latest information at www.NMElite.com


Self-made millionaire: Not buying a home is the single biggest millennial mistake

by Elite Asset Management Team

RE/MAX National Housing Report for January 2019

by Elite Asset Management Team

Housing Inventory Posts Record Increase as Declining Sales Extend to Sixth Month


DENVER – A sixth consecutive month of declining home sales in January contributed to the largest year-over-year inventory increase in at least 10 years, according to the RE/MAX National Housing Report.
 
While year-over-year home sales dropped 11% – extending a streak that began in August – inventory grew year-over-year by an average of 6.4% across the report’s 54 U.S. metro areas. January marked the fourth consecutive month of year-over-year inventory growth – further reversing a decade-long trend of shrinking inventory. December 2018’s year-over-year inventory growth of 4.7% was the previous record in the report’s 10-year history.
 
“The winter chill extended to the housing market in January, as home sales remained cool,” said RE/MAX CEO Adam Contos. “The good news is that inventory levels in January continued to rise on a year-over-year basis, providing incremental improvement in what’s been a multi-year shortage of for-sale homes. This is a positive for homebuyers, as the market continues to swing their way.”
 
The median sales price of $234,000 was a report record for January, increasing 4.6% over January 2018. But the rate of sales price increase was considerably less than the 6.7% posted from January 2017 to January 2018. December 2018 was the only month since January 2012 to show a year-over-year decline in median sales price.
 
Fifty-nine days on market was a record low for January sold listings – averaging one day less than the 60 posted in January 2018. January’s 3.9-month supply of inventory was higher than the 3.4-month supply of January 2018.
 
“Underlying demand remains solid overall, as evidenced by widespread price increases,” said Contos. “So the housing market, while not markedly busy in January, remains relatively healthy. Furthermore, with interest rates stabilizing and home-price increases slowing, the spring selling season shapes up to be as interesting as any we have seen in years.”
 
Closed Transactions 
Of the 54 metro areas surveyed in January 2019, the overall average number of home sales was down 26.1% compared to December 2018, and down 11.0% compared to January 2018. Only Billings, MT, experienced an increase in sales year-over-year, at +7.1%.
 
Median Sales Price – Median of 54 metro median prices
In January 2019, the median of all 54 metro Median Sales Prices was $234,000, down 2.5% from December 2018, and up 4.6% from January 2018. Four metro areas saw a year-over-year decrease in Median Sales Price, including Anchorage, AK, at -3.9%, Pittsburgh, PA, at -2.0%, Trenton, NJ, at -1.5%, and Birmingham, AL, at -0.5%. Six metro areas increased year-over-year by double-digit percentages, with the largest increases seen in Augusta, ME, at +12.1%, Las Vegas, NV, at +11.2%, and Wichita, KS at +10.5%.
 
Days on Market – Average of 54 metro areas
The average Days on Market for homes sold in January 2019 was 59, up four days from the average in December 2018, and down one day from the January 2018 average. The metro areas with the lowest Days on Market were Omaha, NE, at 32, Nashville, TN, at 41, and a three-way tie between Las Vegas, NV, Cincinnati, OH, and San Francisco, CA, at 43. The highest Days on Market averages were in Augusta, ME, at 100, Hartford, CT, at 94, and Anchorage, AK at 93. Days on Market is the number of days between when a home is first listed in an MLS and a sales contract is signed.
 
Months Supply of Inventory – Average of 54 metro areas
The number of homes for sale in January 2019 was down 2.6% from December 2018 and up 6.4% from January 2018. Based on the rate of home sales in January, the Months Supply of Inventory decreased to 3.9 from 4.1 in December 2018, and increased compared to 3.4 in January 2018. A six-months supply indicates a market balanced equally between buyers and sellers. In January 2019, nine of the 54 metro areas surveyed reported a supply at or over six months, typically indicating a buyer’s market, including Miami, FL, at 9.0 and Indianapolis, IN, at 8.6. Nine markets shared the lowest Months Supply of Inventory at 2.0.


Feel free to contact me and I can help break down exactly what these numbers mean for our local market and for your neighborhood. And lastly, If you or anyone you know is thinking of buying or selling a home - please call or email me. I'm here to help!

Peter Veres

Associate Broker,CRS,ABR,CLHMS,SRES

Elite Asset Management Team - RE/MAX Elite

www.PeteVeres.com

Cell: 505-362-2005

RE/MAX National Housing Report for December 2018

by Elite Asset Management Team

2018 Home Sales Cool Off, While Inventory Recovers and Price Increases Moderate


DENVER – December’s declining home sales and growing inventory solidified 2018 as the year the red-hot seller’s market moved toward a balanced market. Price growth also moderated, though December was the 33rd consecutive month of year-over-year increases in home prices, according to the RE/MAX National Housing Report, which includes 53 metro areas.
 
December’s year-over-year decline in home sales of 12.1% set a December record in the 10-year history of the report and also marked the fifth consecutive month that home sales were lower than 2017.  December was 2018’s 10th month of year-over-year declines in home sales with only April and July topping 2017 sales.
 
Most telling was December’s 4.6% growth in inventory, which was also a report record. December’s year-over-year inventory increase marked the third consecutive month of growth – a trend reversing a decade-long streak of year-over-year inventory declines.
 
“December’s inventory gain, continuing the three-month growth trend, is welcome news,” said RE/MAX CEO Adam Contos. “The market remains choppy and there’s still a long way to go, but these gains represent steps toward a balanced market, which in the long run is healthy for both buyers and sellers.”
 
While 54 Days on Market was a record low for December sold listings, the 4.1 Months Supply of Inventory was higher than December 2017’s 3.7 months and ahead of November 2018’s 3.9 months supply.
 
Home buyers paid record amounts throughout 2018 as prices grew year-over-year in every month last year, led by June’s Median Sold Price of $258,500 – an all-time report high. Even so, December’s year-over-year increase of 2.1% was 2018’s smallest, and far lower than the 8.1% price growth from December 2016 to December 2017.
 
“Home sales have cooled, especially during the second half of 2018, but that was inevitable given the strong seller’s market that has persisted for nearly a decade,” Contos said. “We believe sales activity can pick back up if the pace of price escalation continues to moderate, interest rates tick further downward, and wage growth continues.”
 
Closed Transactions 
Of the 53 metro areas surveyed in December 2018, the overall average number of home sales is down -8.5% compared to November 2018, and down -12.1% compared to December 2017. None of the 53 metro areas experienced an increase in sales year-over-year.
 
Median Sales Price – Median of 53 metro median prices
In December 2018, the median of all 53 metro Median Sales Prices was $240,000, up 2.1% from November 2018, and up +2.1% from December 2017. Eight metro areas saw a year-over-year decrease in Median Sales Price, including Honolulu, HI, -7.7%, Birmingham, AL, -4.6%, and Billings, MT, -2.6%. Five metro areas increased year-over-year by double-digit percentages, with the largest increases seen in Boise, ID, +13.1%, Wichita, KS, +11.1%, and Salt Lake City, UT, +10.3%.
 
Days on Market – Average of 53 metro areas
The average Days on Market for homes sold in December 2018 was 54, up three days from the average in November 2018, and down three days from the December 2017 average. The metro areas with the lowest Days on Market were Omaha, NE, at 26, a tie at 37 in San Francisco, CA, and Salt Lake City, UT, and a tie at 38 in Nashville, TN, and Las Vegas, NV. The highest Days on Market averages were in Trenton, NJ, at 113, a tie at 90 in Augusta, ME, and Hartford, CT, and Burlington, VT, at 88. Days on Market is the number of days between when a home is first listed in an MLS and a sales contract is signed.
 
Months Supply of Inventory – Average of 53 metro areas
The number of homes for sale in December 2018 was down -10.8% from November 2018 and up +4.6% from December 2017. Based on the rate of home sales in December, the Months Supply of Inventory increased to 4.1 from 3.9 in November 2018, and increased compared to December 2017 at 3.7. In December 2018, four of the 53 metro areas surveyed reported a months supply over six, including Miami, FL, at 10.9 and Augusta, ME, at 8.9, which is typically considered a buyer’s market. The markets with the lowest Months Supply of Inventory are San Francisco, CA, at 1.8, Denver, CO, at 2.1, and Minneapolis, MN, at 2.2.
 

Feel free to contact me and I can help break down exactly what these numbers mean for our local market and for your neighborhood. And lastly, If you or anyone you know is thinking of buying or selling a home - please call or email me. I'm here to help!


Peter Veres

Associate Broker,CRS,ABR,CLHMS,SRES

Elite Asset Management Team - RE/MAX Elite

www.PeteVeres.com

Cell: 505-362-2005

Displaying blog entries 61-70 of 240

Syndication

Categories

Archives

Contact Information

Photo of Elite Asset Management  Real Estate
Elite Asset Management
RE/MAX SELECT
8300 Carmel Ave. NE Ste. 203
Albuquerque NM 87122
(505)362-2005

zillow reviews