Real Estate Information Archive

Blog

Displaying blog entries 51-60 of 240

RE/MAX National Housing Report for July 2019

by Elite Asset Management Team

Home Sales Increase 2.4% in July, Ending Nine Months of Inventory Growth 


DENVER  July home sales bounced back after a sluggish June by increasing 2.4% year over year, according to the RE/MAX National Housing Report. This was enough to end nine months of year-over-year inventory growth as the number of homes for sale declined 1.4%.

A drop in home sales from June to July is typical in the report's 53 metro areas. But the 0.2% decline from June to July 2019 was by far the smallest month-over-month decline since July 2013. And while June sales failed to top May for only the second time in the report's 10-year history, July sales set a report record for the month.

"July sales snapped back after a tepid June, as attractive low interest rates appear to have brought more buyers into the mix," said RE/MAX CEO Adam Contos. "The housing market has been a bit uneven since the early spring, with each encouraging month seemingly followed by one with lukewarm results. It's possible the housing market has finally shaken some mud off its boots and can maintain its momentum for the back half of the year. If the broader macro environment hangs on, we could see a potentially strong finish to 2019."

July's Median Sales Price of $273,000 - while down slightly from June's all-time report record high - was 9.2% higher than July of 2018. It marked the seventh consecutive month of year-over-year price growth. Home prices have risen, year over year, in 88 of the last 90 months dating back to February 2012. Said Contos, "Although lower interest rates help affordability, we have now seen two straight months of accelerating price increases. If the trend continues, it's not an encouraging development for buyers."

July's Days on Market total of 43 saw sales closing at the same rate as they did in June, but taking two days longer than in July 2018. Months of Inventory in July 2019 totaled 2.7, down compared to June's 2.9 and 3.3 in July 2018.

Closed Transactions 
Of the 53 metro areas surveyed in July 2019, the overall average number of home sales is down 0.2% compared toJune 2019, and up 2.4% compared to July 2018. Leading the month-over-month sales percentage increase wereHonolulu, HI at +11.8%, Anchorage, AK at +10.2%, and New York, NY at +9.2%.

Median Sales Price – Median of 53 metro median prices
In July 2019, the median of all 53 metro Median Sales Prices was $273,000, down 0.7% from June 2019, and up 9.2% from July 2018. Three metro areas saw a year-over-year decrease in Median Sales Price including Anchorage, AK at -3.2%, Trenton, NJ at -2.1%, and San Francisco, CA at -2.0%. Five metro areas increased year-over-year by double-digit percentages, with the largest increases seen in Wichita, KS at +16.7%, Cleveland, OH at +12.9%, and Cincinnati, OH at +11.7%.

Days on Market – Average of 53 metro areas 
The average Days on Market for homes sold in July 2019 was 43, equivalent to the average in June 2019, and up two days from the July 2018 average. The metro areas with the lowest Days on Market were Omaha, NE at 21, Manchester, NH at 24, and Cincinnati, OH at 26. The highest Days on Market averages were in Augusta, ME at 87, Miami, FL at 82, and Hartford, CT at 72. Days on Market is the number of days between when a home is first listed in an MLS and a sales contract is signed.

Months Supply of Inventory – Average of 53 metro areas 
The number of homes for sale in July 2019 was down 2.2% from June 2019 and down 1.4% from July 2018. Based on the rate of home sales in July 2019, the Months Supply of Inventory decreased to 2.7 compared to 2.9 in June 2019, and decreased compared to 3.3 in July 2018. A six months supply indicates a market balanced equally between buyers and sellers. In July 2019, of the 53 metro areas surveyed, only Miami, FL at 6.8 reported a months supply at or over six, which is typically considered a buyer's market. The markets with the lowest Months Supply of Inventory were Phoenix, AZ and Boise, ID, both at 1.5.


Feel free to contact me and I can help break down exactly what these numbers mean for our local market and for your neighborhood. And lastly, If you or anyone you know is thinking of buying or selling a home - please call or email me. I'm here to help!

Peter Veres

Associate Broker,CRS,ABR,CLHMS,SRES

Elite Asset Management Team - RE/MAX Elite

www.PeteVeres.com

Cell: 505-362-2005

Rent Vs. Own

by Elite Asset Management Team


Some Highlights:

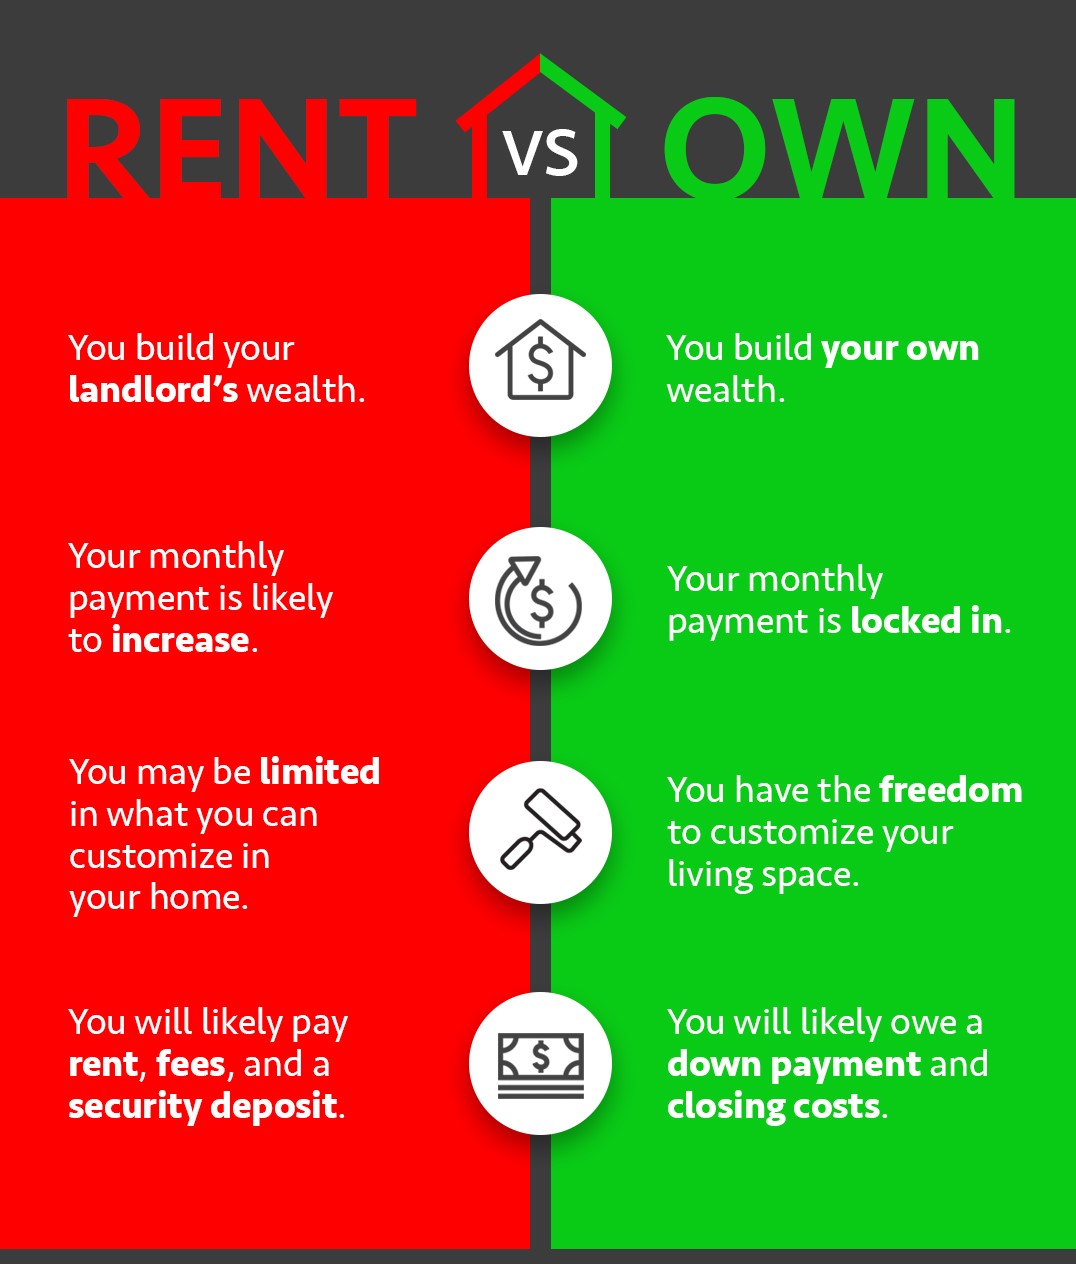
  • Owning your own home vs. renting may lead to some great options, such as locking in your monthly payments and having the freedom to customize your living space.
  • Whether you rent or own, you have to cover someone’s mortgage costs. You may as well be doing so to build your own wealth, rather than that of your landlord.
  • Renting and owning both have up-front fees when you sign your lease or close, respectively. Think about putting that money to work for you! 

Meet with a realtor like Pete Veres, CRS – Certified Residential Specialist & ABR – Accredited Buyers and Seller Representative who can help you navigate thru the process and get the job done for you. He can provide you with a Free Market analysis when you are ready. Pete Veres has had over 25 years of Sales & Marketing experience, excellent negotiating skills and a superb track record.

You can contact him by calling or texting him at 505-362-2005 or by emailing him at [email protected].

He has a great website full of the latest information at www.NMElite.com

Here are also some Free Sellers resources. VIP-Seller-Resources


RE/MAX National Housing Report for June 2019

by Elite Asset Management Team

June Sales Post Unusual Decline as Median Price Reaches All-Time High


DENVER – Typically the strongest month for home sales, June saw closings decline 4.7% from May and 7.8% from June 2018, according to the RE/MAX National Housing Report. Going in the opposite direction, June’s Median Sales Price of $276,000 was an all-time high in the 10-year history of the report.
 
June has recorded the most sales each of the last five years (July led 2013 sales). This is only the second June in report history to have fewer sales than May. With sales slowing, June inventory increased 1.3% over June 2018, marking the first year-over-year rise in June inventory in the report’s history. Moreover, inventory grew for the ninth consecutive month, and the report’s 54 metro areas had the most units for sale since August 2016.
 
“Record prices appear to have kept June sales figures from topping a strong May,” said RE/MAX CEO Adam Contos. “Nevertheless, there are indications, including the return of very favorable mortgage rates, that the pace could pick up in July. Several encouraging longer-term trends—ongoing demand, improving inventory levels, low interest rates—are helping the market make incremental progress on multiple fronts. But supply remains a concern, so we need more homes to be built.”

Starting in 2013, June has also produced the highest Median Sales Price of each year. June’s record $276,000 was 6.7% higher than the $259,000 recorded in June 2018.  June’s price increase accelerated compared to the prior three months, each of which had a year-over-price increase of less than 3.5%. Contos continued, “The jump in sales price after months of moderation is worth watching for its impact on affordability.”
 
June’s Days on Market total of 44 meant that sales happened three days faster than in May but took three days longer than June 2018. Months of Inventory in June 2019 was 2.8, the same as May’s and below June 2018’s 3.1.
 
Closed Transactions 
Of the 54 metro areas surveyed in June 2019, the overall average number of home sales is down 4.7% compared to May 2019, and down 7.8% compared to June 2018. Leading the month-over-month sales percentage increase were Burlington, VT at +21.8%; Boston, MA at +13.4%; and Hartford, CT at +13.1%.
 
Median Sales Price – Median of 54 metro median prices
In June 2019, the median of all 54 metro Median Sales Prices was $276,000, up 6.2% from May 2019, and up 6.7% from June 2018. Two metro areas saw a year-over-year decrease in Median Sales Price: San Francisco, CA at -2.0%, and Hartford, CT at -0.1%. Three metro areas increased year-over-year by double-digit percentages, with Boise, ID at +10.7%; Albuquerque, NM at +10.4%; and Philadelphia, PA at +10.0%.
 
Days on Market – Average of 54 metro areas
The average Days on Market for homes sold in June 2019 was 44, down three days from the average in May 2019, and up three days from the June 2018 average. The metro areas with the lowest Days on Market were Omaha, NE at 22; Denver, CO at 25; and Seattle, WA at 26. The highest Days on Market averages were in Augusta, ME at 108; Miami, FL at 82; and Hartford, CT at 74. Days on Market is the number of days between when a home is first listed in an MLS and a sales contract is signed.
 
Months Supply of Inventory – Average of 54 metro areas
The number of homes for sale in June 2019 was down 0.6% from May 2019 and up 1.3% from June 2018. Based on the rate of home sales in June 2019, the Months Supply of Inventory held steady at 2.8 from May 2019, and decreased compared to 3.1 in June 2018. A six months supply indicates a market balanced equally between buyers and sellers. In June 2019, of the 54 metro areas surveyed, only Miami, FL at 7.0 reported a months supply at or over six, which is typically considered a buyer’s market. The markets with the lowest Months Supply of Inventory were Omaha, NE and Manchester, NH, both at 1.0, and Minneapolis, MN at 1.8.

Feel free to contact me and I can help break down exactly what these numbers mean for our local market and for your neighborhood. And lastly, If you or anyone you know is thinking of buying or selling a home - please call or email me. I'm here to help!

Peter Veres

Associate Broker,CRS,ABR,CLHMS,SRES

Elite Asset Management Team - RE/MAX Elite

www.PeteVeres.com

Cell: 505-362-2005

Home Price Appreciation Forecast

by Elite Asset Management Team


Questions continue to come up about where home prices will head throughout the rest of this year, as well as where they may be going over the few years beyond.


We’ve gathered current data from the industry’s most reliable sources to help answer these questions:


The Home Price Expectation Survey – A survey of over 100 market analysts, real estate experts, and economists conducted by Pulsenomics each quarter.


Mortgage Bankers Association (MBA) – As the leading advocate for the real estate finance industry, the MBA enables members to successfully deliver fair, sustainable, and responsible real estate financing within ever-changing business environments.


Zelman & Associates – The firm leverages unparalleled housing market expertise, extensive surveys of industry executives, and rigorous financial analysis to deliver proprietary research and advice to leading global institutional investors and senior-level company executives.


Freddie Mac – An organization whose mission is to provide liquidity, stability, and affordability to the U.S. housing market in all economic conditions extending to all communities from coast to coast.


The National Association of Realtors (NAR) – The largest association of real estate professionals in the world.


Fannie Mae – A leading source of financing for mortgage lenders, providing access to affordable mortgage financing in all markets.


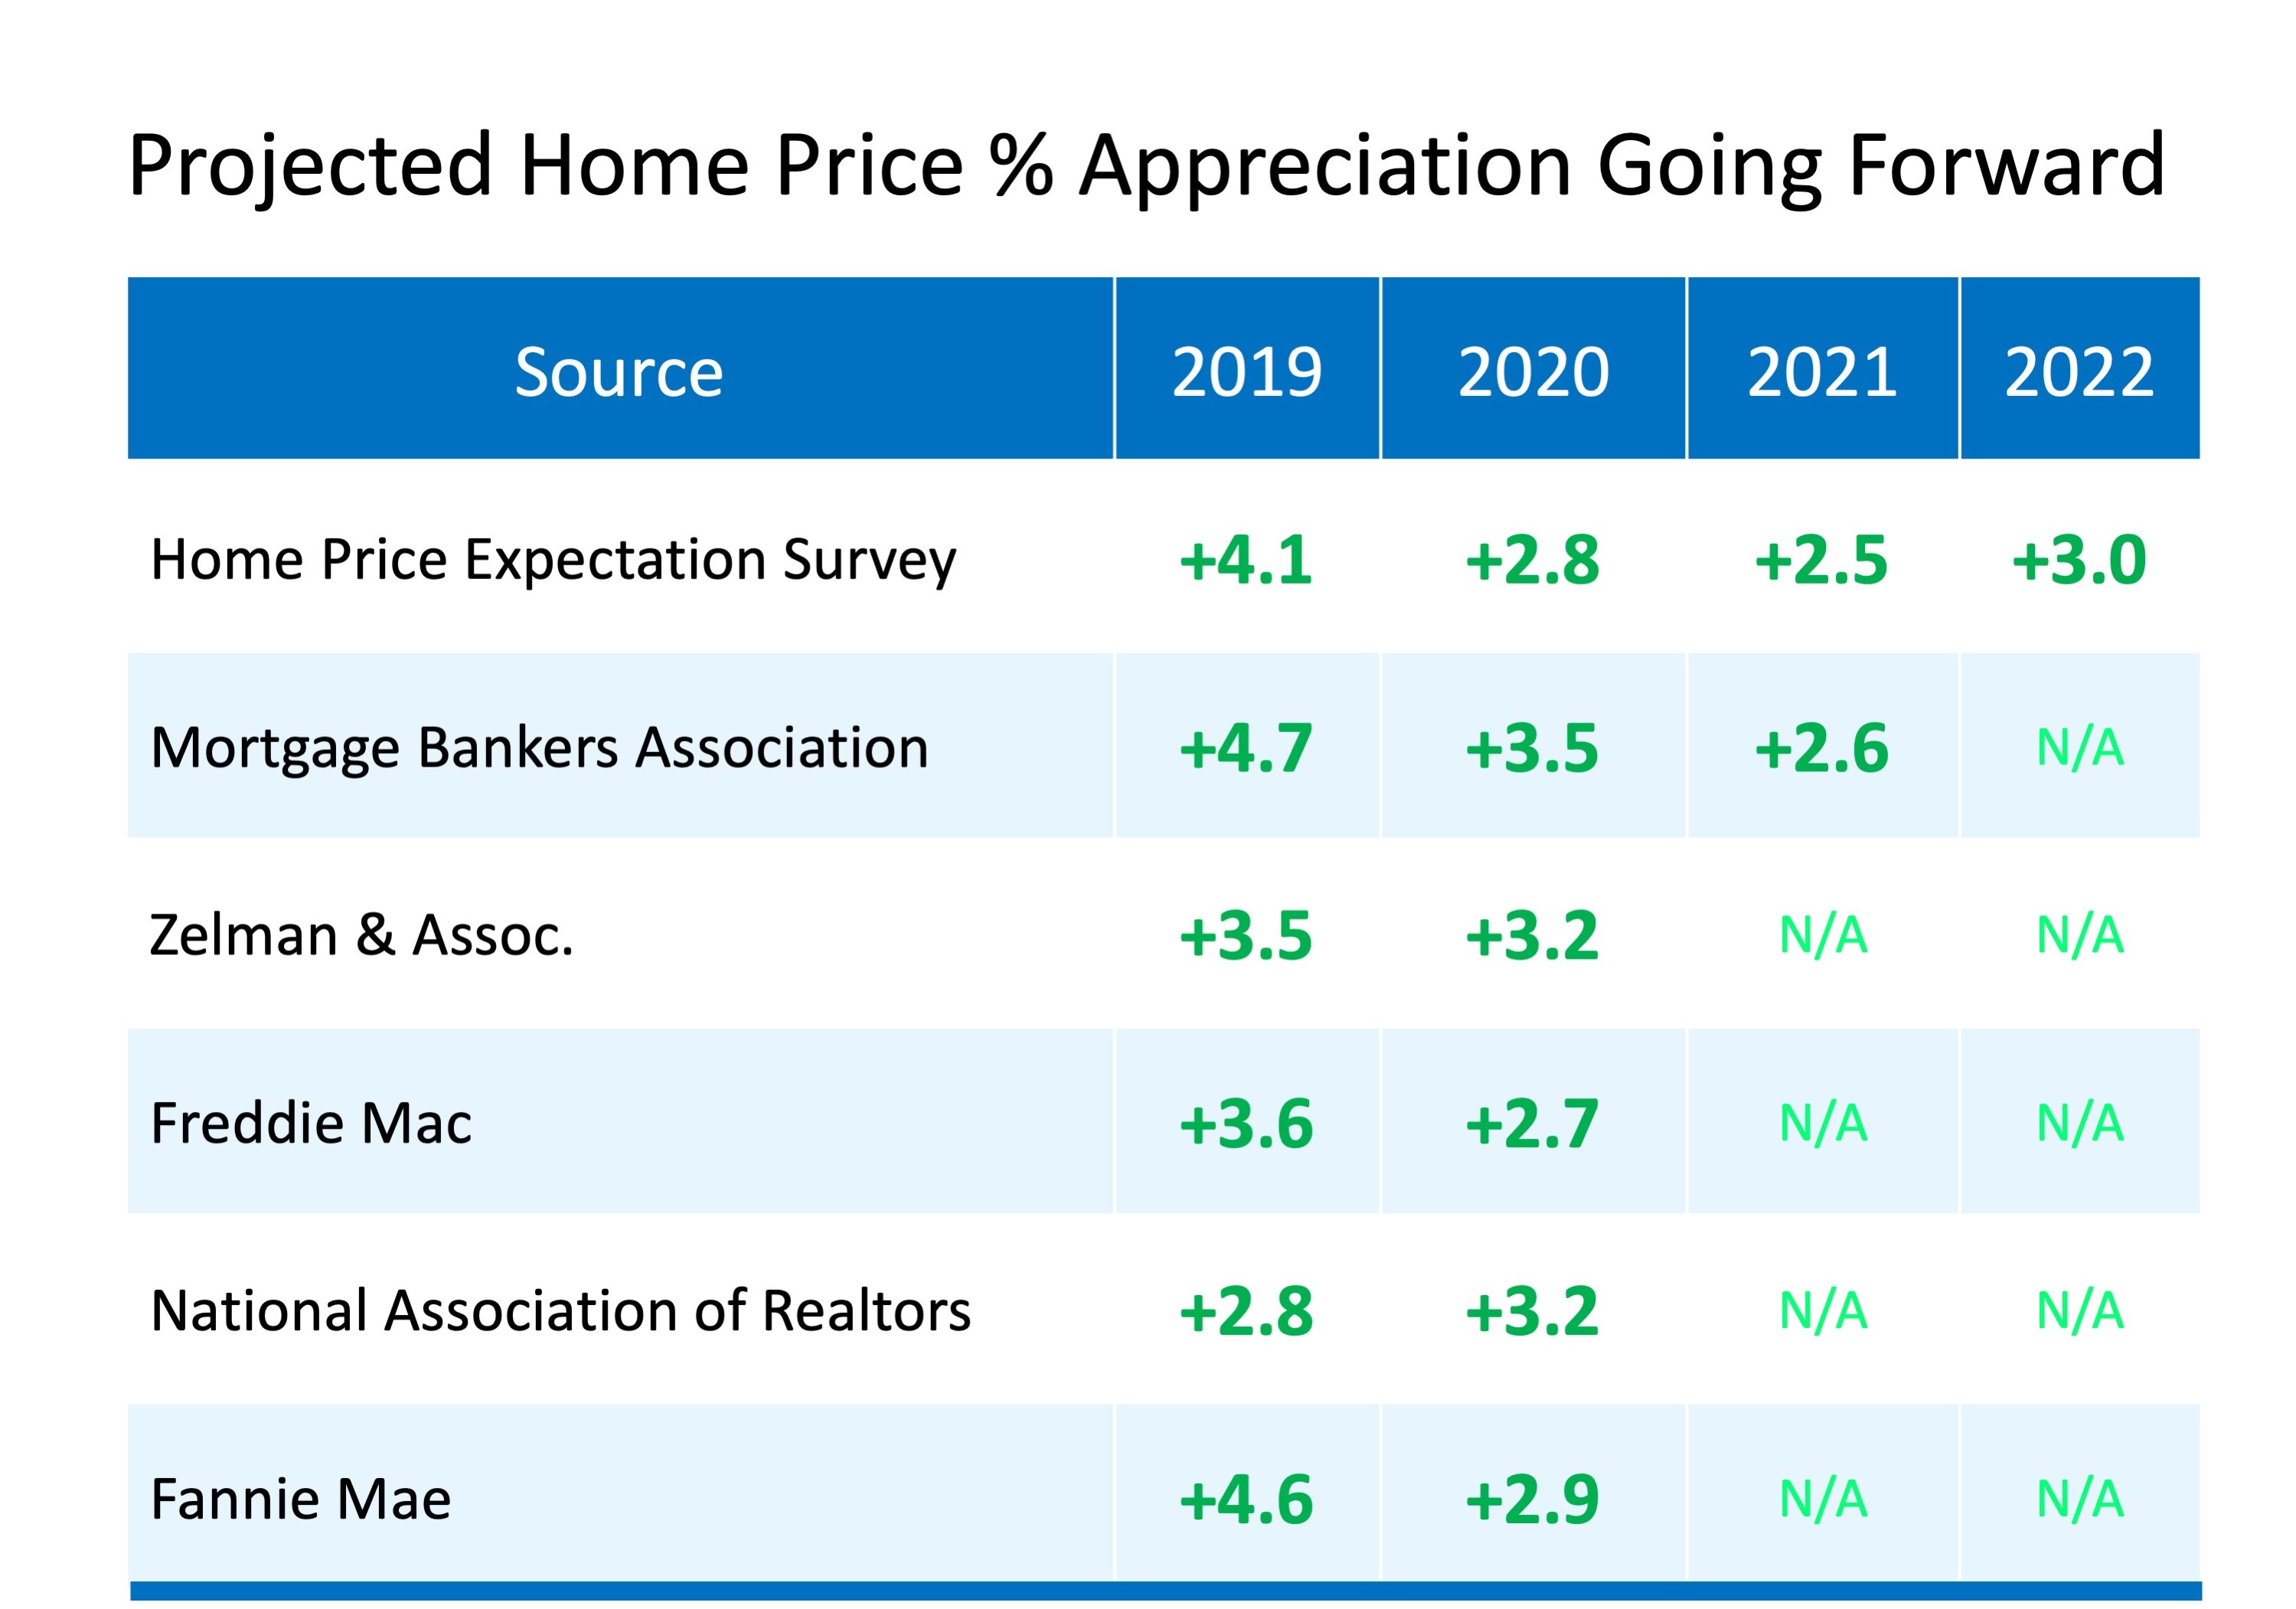
Here’s the home price appreciation these experts are projecting over the next few years:


Bottom Line

Every source sees home prices continuing to appreciate, which is great news for the strength of the market. The increase is steepest throughout the rest of 2019, and prices should continue to rise as we move through 2020 and beyond.


Meet with a realtor like Pete Veres, CRS – Certified Residential Specialist & ABR – Accredited Buyers and Seller Representative who can help you navigate thru the process and get the job done for you. He can provide you with a Free Market analysis when you are ready. Pete Veres has had over 25 years of Sales & Marketing experience, excellent negotiating skills and a superb track record.

You can contact him by calling or texting him at 505-362-2005 or by emailing him at [email protected].

He has a great website full of the latest information at www.NMElite.com

Here are also some Free Sellers resources. VIP-Seller-Resources


RE/MAX National Housing Report for May 2019

by Elite Asset Management Team

Home Sales Accelerate While Inventory Hits 34-Month High


DENVER – May home sales ticked slightly higher year-over-year, ending a 9-month streak of declines, according to the RE/MAX National Housing Report. At the same time, inventory grew for the eighth consecutive month, representing the most units for sale since August 2016 in the report’s 54 metro areas.
 
Homes sold quickly, as evident in the Days on Market average of 47 – the second-fastest May average in the 10-year history of the report. And home sales increased 15.3% from April to May – the second-highest April-May jump in report history.
 
Home sales were up 0.4% over May 2018 - the first year-over-year gain since July 2018. The number of homes for sale increased 4.9% year-over-year to set a report record for the highest May growth. However, based on the pace of home sales, May’s 2.6 Months of Inventory was down compared to April’s 2.8 months and the 2.9 months of May 2018.
 
The Median Sales Price of $259,500 was up 3.4% year-over-year, representing the lowest May increase since 2011.
 
“The spring selling season was in full bloom during the month of May, offering both buyers and sellers something to like,” said RE/MAX CEO Adam Contos. “Buyers are generally finding increased selection along with moderating price increases.  At the same time, in general, sellers are selling their homes quickly while still enjoying some price gains. Bottom line, the market is operating efficiently right now, and homes are selling, on average, at a good clip.”
 
Closed Transactions 
Of the 54 metro areas surveyed in May 2019, the overall average number of home sales is up 15.3% compared to April 2019, and up 0.4% compared to May 2018. Leading the month-over-month sales increase were Billings, MT at +64.2%, Burlington, VT at +61.6%, and Minneapolis, MN at +35.8%.
 
Median Sales Price – Median of 54 metro median prices
In May 2019, the median of all 54 metro Median Sales Prices was $259,500, up 3.3% from April 2019, and up 3.4% from May 2018. Three metro areas saw a year-over-year decrease in Median Sales Price: San Francisco, CA at -5.1%, Honolulu, HI at -3.2%, and Billings, MT at  -1.6%. Three metro areas increased year-over-year by double-digit percentages: Milwaukee, WI at +14.2%, Boise, ID at +13.6%, and Albuquerque, NM at +10.2%.
 
Days on Market – Average of 54 metro areas
The average Days on Market for homes sold in May 2019 was 47, down five days from the average in April 2019, and up two days from the May 2018 average. The metro areas with the lowest Days on Market were Omaha, NE at 25, and San Francisco, CA and Denver, CO, both at 26. The highest Days on Market averages were in Augusta, ME at 106, Miami, FL at 87, and Hartford, CT at 84. Days on Market is the number of days between when a home is first listed in an MLS and a sales contract is signed.
 
Months Supply of Inventory – Average of 54 metro areas
The number of homes for sale in May 2019 was up 4.5% from April 2019 and up 4.9% from May 2018. Based on the rate of home sales in May 2019, the Months Supply of Inventory decreased to 2.6 from 2.8 in April 2019, and decreased compared to 2.9 in May 2018. A six months supply indicates a market balanced equally between buyers and sellers. In May 2019, of the 54 metro areas surveyed, only Miami, FL at 6.2 reported a months supply at or over six. The markets with the lowest Months Supply of Inventory were Boise, ID at 1.2, Omaha, NE at 1.3, and Manchester, NH and San Francisco, CA, both at 1.4.

Feel free to contact me and I can help break down exactly what these numbers mean for our local market and for your neighborhood. And lastly, If you or anyone you know is thinking of buying or selling a home - please call or email me. I'm here to help!

Peter Veres

Associate Broker,CRS,ABR,CLHMS,SRES

Elite Asset Management Team - RE/MAX Elite

www.PeteVeres.com

Cell: 505-362-2005


5 Reasons To Sell Your House This Summer

by Elite Asset Management Team


Here are 5 compelling reasons listing your home for sale this summer makes sense.


1. Demand Is Strong


The latest Buyer Traffic Index from the National Association of Realtors (NAR) shows that buyer demand remains strong throughout the vast majority of the country. These buyers are ready, willing, and able to purchase… and are in the market right now! More often than not, multiple buyers are competing with each other for the same home.


Take advantage of the buyer activity currently in the market.


2. There Is Less Competition Now


Housing inventory is still under the 6-month supply needed for a normal housing market. This means that, in most of the country, there are not enough homes for sale to satisfy the number of buyers.


Historically, the average number of years a homeowner stayed in his or her home was six, but that number has hovered between nine and ten years since 2011. Many homeowners have a pent-up desire to move, as they were unable to sell over the last few years due to a negative equity situation. As home values continue to appreciate, more and more homeowners are granted the freedom to move.


Many homeowners were reluctant to list their home over the last couple of years for fear that they would not find a home to move in to. That is all changing now as more homes come to market at the higher end. The choices buyers have will continue to increase. Don’t wait until additional inventory comes to market before you to decide to sell.


3. The Process Will Be Quicker


Today’s competitive environment has forced buyers to do all they can to stand out from the crowd, including getting pre-approved for their mortgage financing. Buyers know exactly what they can afford before home shopping. This makes the entire selling process much faster and simpler. According to Ellie Mae’s latest Origination Insights Report, the time to close a loan has dropped to 43 days. (Last numbers available.)


4. There Will Never Be a Better Time to Move Up


If your next move will be into a premium or luxury home, now is the time to move up! The inventory of homes for sale at these higher price ranges has created a buyer’s market. This means that if you are planning on selling a starter or trade-up home, it will sell quickly, AND you’ll be able to find a premium home to call your own!


According to CoreLogic, prices are projected to appreciate by 4.8% over the next year. If you are moving to a higher-priced home, it will wind up costing you more in raw dollars (both in down payment and mortgage payment) if you wait.


5. It’s Time to Move on with Your Life


Look at the reason you decided to sell in the first place and determine whether it is worth waiting. Is money more important than being with family? Is money more important than having the freedom to go on with your life the way you think you should?


Only you know the answers to these questions. You have the power to take control of the situation by putting your home on the market. Perhaps the time has come for you and your family to start living the life you desire.

Meet with a realtor like Pete Veres, CRS – Certified Residential Specialist & ABR – Accredited Buyers and Seller Representative who can help you navigate thru the process and get the job done for you. He can provide you with a Free Market analysis when you are ready. Pete Veres has had over 25 years of Sales & Marketing experience, excellent negotiating skills and a superb track record.

You can contact him by calling or texting him at 505-362-2005 or by emailing him at [email protected].

He has a great website full of the latest information at www.NMElite.com

Here are also some Free Sellers resources. VIP-Seller-Resources

Renting Or Owning, What Is Better For You?

by Elite Asset Management Team


In a real estate market where home prices are rising, many have begun to reexamine the idea of buying a home, choosing instead, to rent for a while. But often, there is a dilemma: should you keep paying rent, knowing that rent is rising too, or should you lock in your housing cost and buy a home?

Let’s look at both scenarios and analyze the pros and cons of each:

Renting

With the housing market crash in 2008, many homeowners lost their homes and became renters. According to Iproperty Management, “the number of households renting their home … rose from 31.2% of households in 2006 to 36.6% in 2016”.

Some choose to rent because it is more convenient for their lifestyle. Those whose job requires frequent moves need the flexibility that a 6-12 month lease agreement gives them so they can move to their next assignment!

Many renters believe that renting is cheaper because they do not have to pay for maintenance and repairs. (Not true! Landlords work those expenses into your rent and other fees). Another reason many rent is that they feel like they cannot afford the down payment and closing costs required to buy a house, due to their inability to save much after paying their monthly expenses.

That can be true! Nearly 1 in 4 renters spend at least half their household income on rent. In 2017 the “severely” burdened renters’ rate was 24.7% with 24.9% reporting they were “moderately” burdened.

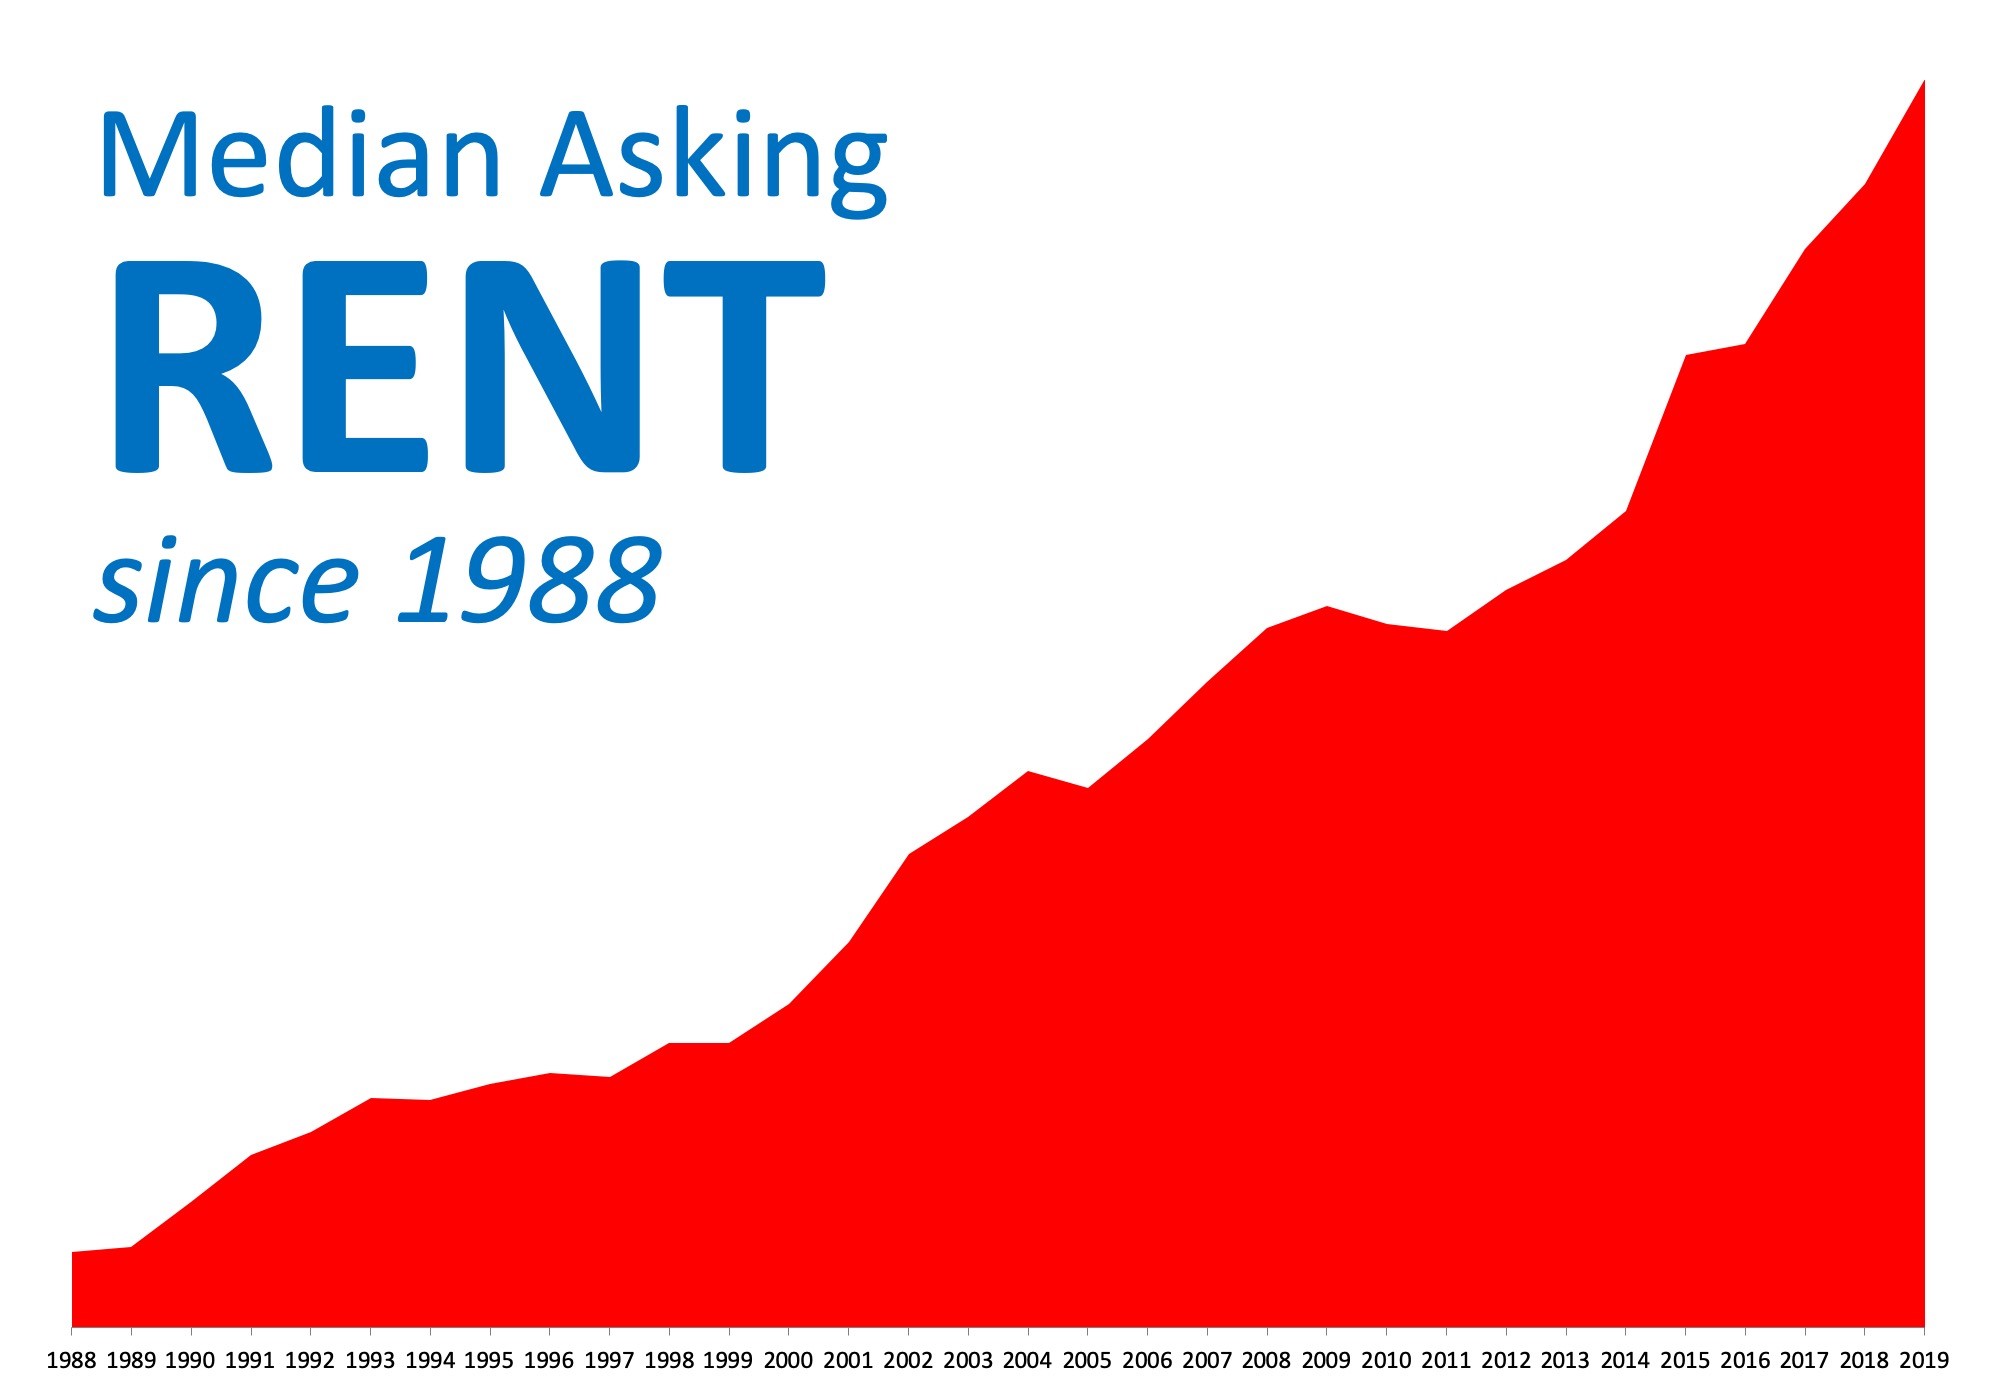
Renting also brings some financial disadvantages. Homeowners can take advantage of tax deductions that let them claim their property taxes and mortgage interest. Additionally, there is a big risk that your rent will go up every time you renew your lease, as we know the median asking rent has been increased steadily since 1988!


One of the major challenges with renting is that you don’t have a space to call your own. When you rent, you are paying your landlord’s mortgage, and therefore they are the beneficiaries of the equity gained from paying that mortgage.

Now let’s explore the other side: Homeownership

In the past, we have mentioned the many financial and non-financial benefits of becoming a homeowner. So, let’s just focus on the one big difference between renting and owning, the ability to lock in your housing cost!

Assuming you will have a fixed-rate mortgage, your costs are predictable! You will know exactly what your mortgage payment will be for the next 15-30 years. The homeownership rate in 2018 was 64.4%, and has been on the rise. Those households locked in their housing cost rather than wait for their landlord to raise their rent again!

What are the disadvantages of owning a home? Well, it is a long-term financial commitment! It is not easy to pack quickly and move. You will need time and good planning to do it in a short amount of time.

You need to save your money! Getting a mortgage requires a down payment, closing costs, and moving expenses. Again, that will require some savings and planning!

Unless you have a homeowner’s association (HOA) (and you pay an HOA fee) or a home warranty, you will be responsible for maintenance and taking care of the home. This may range anywhere from regular landscaping to major repairs.

Bottom Line

Like everything in life, there are pros and cons. What is better for you depends on your situation! If you are interested in becoming a homeowner and want to discuss the pros and cons, contact a local real estate professional that can help you review your current situation!


Meet with a realtor like Pete Veres, CRS – Certified Residential Specialist & ABR – Accredited Buyers and Seller Representative who can help you navigate thru the process and get the job done for you. He can provide you with a Free Market analysis when you are ready. Pete Veres has had over 25 years of Sales & Marketing experience, excellent negotiating skills and a superb track record.

You can contact him by calling or texting him at 505-362-2005 or by emailing him at [email protected].

He has a great website full of the latest information at www.NMElite.com

Here are also some Free Sellers resources. VIP-Seller-Resources

The Impact Staging Your Home Has On Your Sale Price

by Elite Asset Management Team


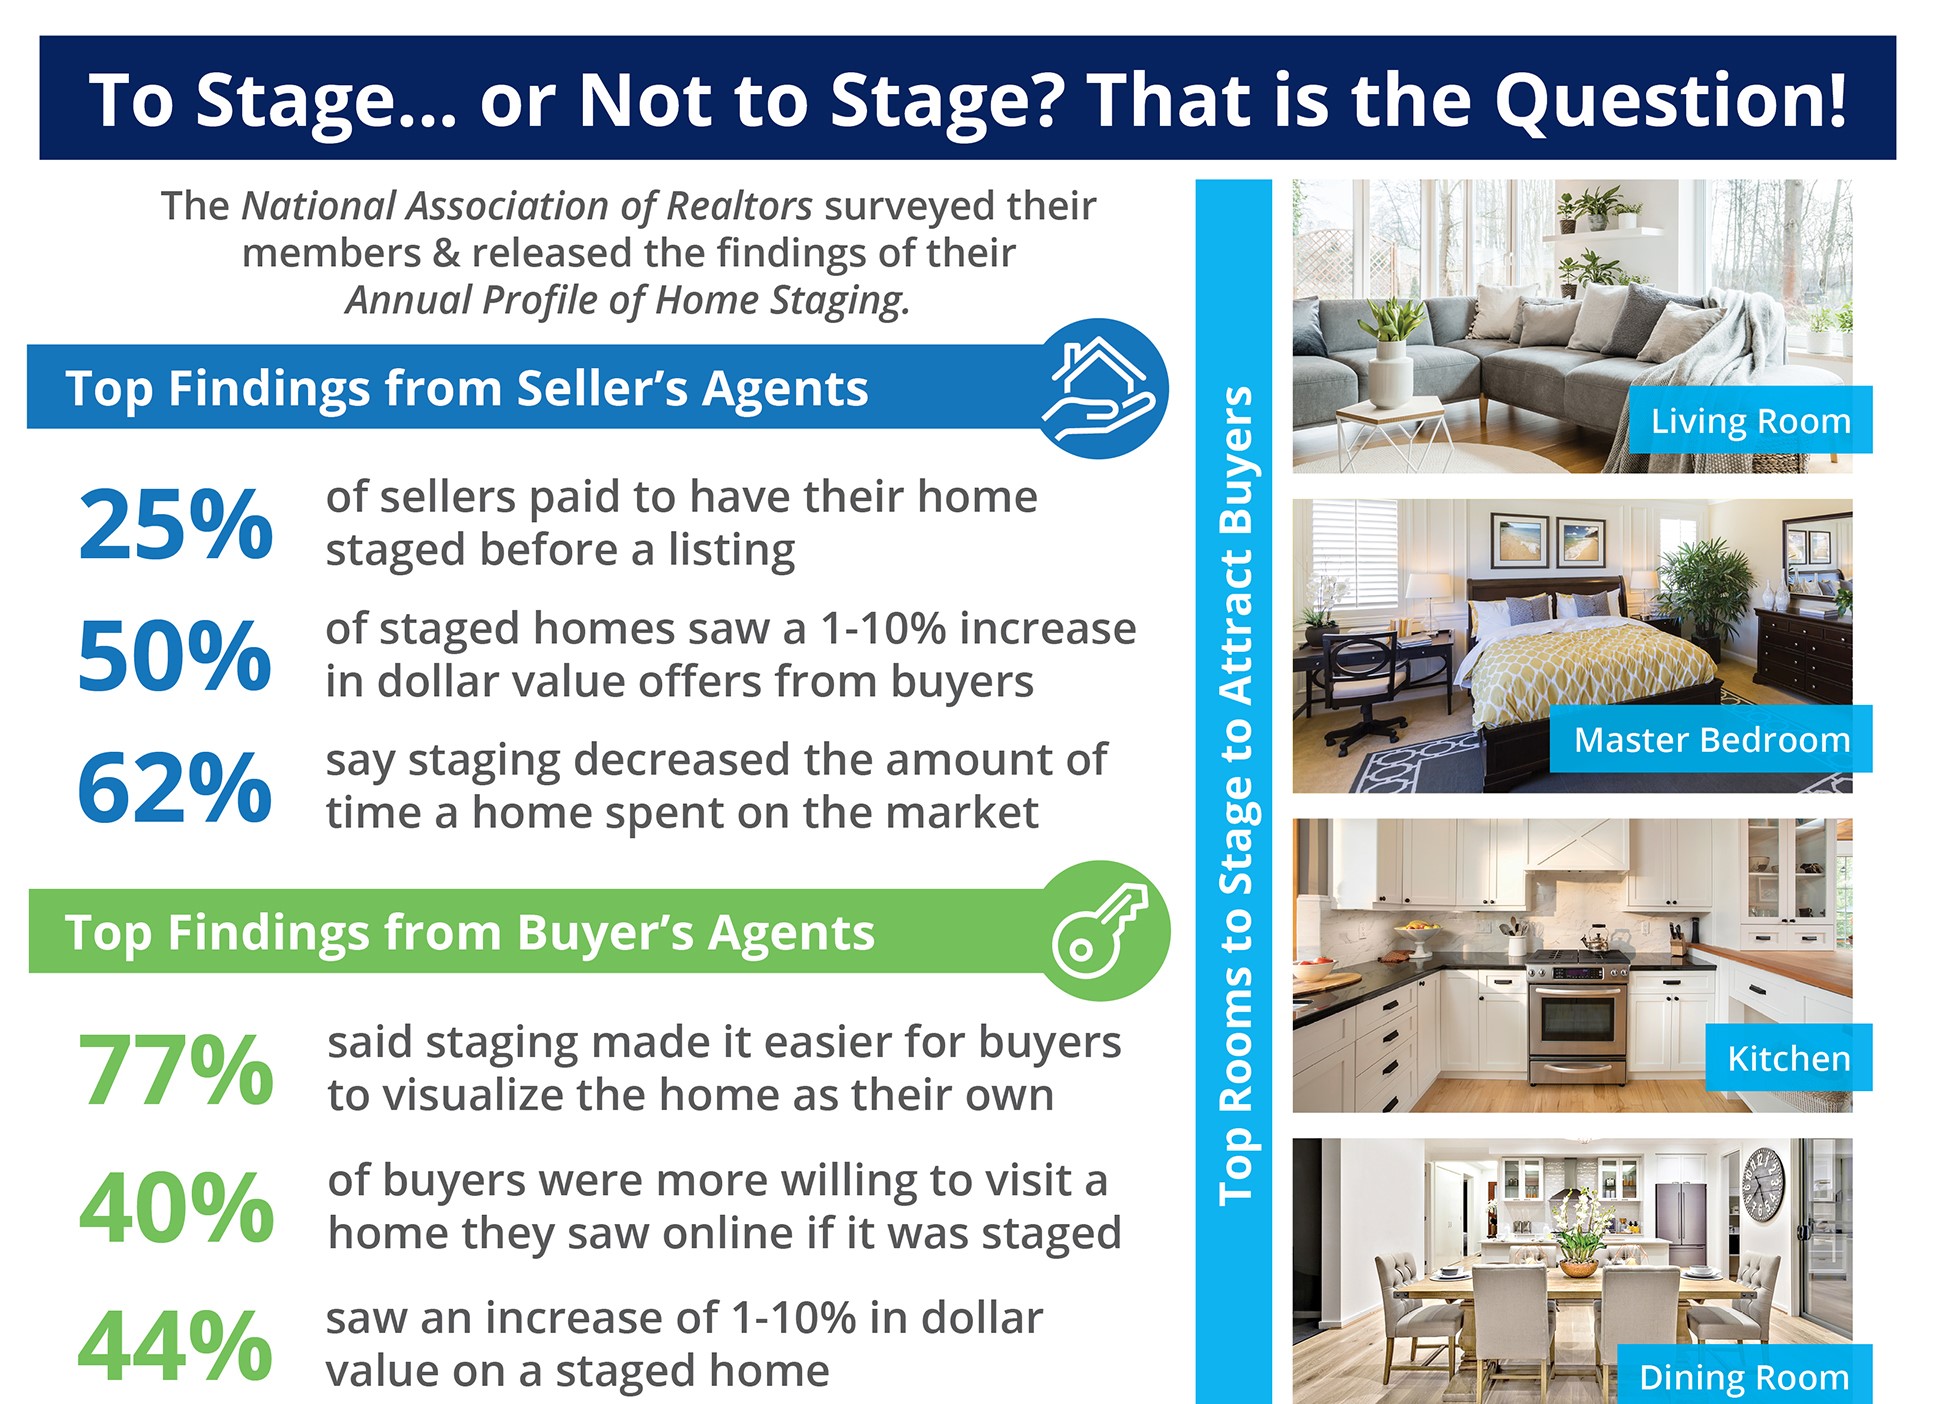
  • The National Association of Realtors surveyed their members & released the findings of their Profile of Home Staging.
  • 62% of seller’s agents say that staging a home decreases the amount of time a home spends on the market.
  • 50% of staged homes saw a 1-10% increase in dollar-value offers from buyers.
  • 77% of buyer’s agents said staging made it easier for buyers to visualize the home as their own.
  • The top rooms to stage in order to attract more buyers are the living room, master bedroom, kitchen, and dining room.


Meet with a realtor like Pete Veres, CRS – Certified Residential Specialist & ABR – Accredited Buyers and Seller Representative who can help you navigate thru the process and get the job done for you. He can provide you with a Free Market analysis when you are ready. Pete Veres has had over 25 years of Sales & Marketing experience, excellent negotiating skills and a superb track record.

You can contact him by calling or texting him at 505-362-2005 or by emailing him at [email protected].

He has a great website full of the latest information at www.NMElite.com

Here are also some Free Sellers resources. VIP-Seller-Resources


RE/MAX National Housing Report for April 2019

by Elite Asset Management Team

Spring Home Sales Back on Pace as Price Increases Moderate


DENVER – April home sales finished just 1.1% below a year ago as selling times shortened and tight inventory held steady, according to the RE/MAX National Housing Report. Meanwhile, April’s median home price of $251,000 in the report’s 54 markets was up a mere 2.1% - the smallest year-over-year April increase in eight years.
 
April’s year-over-year sales decline of 1.1% marked the ninth consecutive month of year-over-year decreases, but April’s sales dip was the smallest during that time. At the same time, inventory increased 4.8% and marked the seventh consecutive month of year-over-year growth in number of homes for sale.
 
Compared to March, home sales in April sped up by a full week, taking an average of 52 days instead of 59. The average in April 2018 was 51 days. The Months Supply of Inventory in April decreased year-over-year from 3.0 to 2.6.
 
While the March-over-February increase in home sales of 28.8% was the smallest in five years, the April-over-March increase of 11.2% was an April-over-March record for the 10-year history of the report.
 
“April’s home sales blossomed, suggesting the typical seasonal jump in spring sales arrived later than usual this year,” said RE/MAX CEO Adam Contos. “Solid buyer interest and sellers with realistic price expectations advanced the market’s march toward equilibrium last month. That said, inventory remains constricted, and prices continue to climb, albeit at a slower rate. All in all, April’s results were encouraging, and we continue to be cautiously optimistic about the prospects of a healthy spring selling season.” 
 
Closed Transactions 
Of the 54 metro areas surveyed in April 2019, the overall average number of home sales is up 11.2% compared to March 2019, and down 1.1% compared to April 2018. Leading the month-over-month sales percentage increase were Augusta, ME, at +30.4%, Des Moines, IA, at +23.6%, and Milwaukee, WI, at +22.9%.
 
Median Sales Price – Median of 54 metro median prices
In April 2019, the median of all 54 metro Median Sales Prices was $251,000, up 2.1% from March 2019, and up 2.1% from April 2018. Three metro areas saw a year-over-year decrease in Median Sales Price: San Francisco, CA, at -1.4%, Seattle, WA, at -1.0%, and Anchorage, AK, at -0.3%. Four metro areas increased year-over-year by double-digit percentages, with the largest gains in Boise, ID, at +14.8% and Birmingham, AL, at +13.8%.
 
Days on Market – Average of 54 metro areas
The average Days on Market for homes sold in April 2019 was 52, down seven days from the average in March 2019, and up one day from the April 2018 average. The metro areas with the lowest Days on Market were Omaha, NE, at 27, and Denver, CO, and San Francisco, CA, both at 30. The highest Days on Market averages were in Augusta, ME, at 116, Hartford, CT, at 89, and Miami, FL, at 86. Days on Market is the number of days between when a home is first listed in an MLS and a sales contract is signed.
 
Months Supply of Inventory – Average of 54 metro areas
The number of homes for sale in April 2019 was up 3.3% from March 2019 and up 4.8% from April 2018. Based on the rate of home sales in April 2019, the Months Supply of Inventory decreased to 2.6 from 2.9 in March 2019, and decreased compared to 3.0 in April 2018. A six months supply indicates a market balanced equally between buyers and sellers. In April 2019, of the 54 metro areas surveyed, only Miami, FL, at 6.3 reported a months supply at or over six, which is typically considered a buyer’s market. The markets with the lowest Months Supply of Inventory were Boise, ID, Denver, CO, Manchester, NH, and Omaha, NE, all at 1.2.

Feel free to contact me and I can help break down exactly what these numbers mean for our local market and for your neighborhood. And lastly, If you or anyone you know is thinking of buying or selling a home - please call or email me. I'm here to help!

Peter Veres

Associate Broker,CRS,ABR,CLHMS,SRES

Elite Asset Management Team - RE/MAX Elite

www.PeteVeres.com

Cell: 505-362-2005


SANDIA HEIGHTS STUFF THE TRUCK EVENT

by Elite Asset Management Team

Displaying blog entries 51-60 of 240

Syndication

Categories

Archives

Contact Information

Photo of Elite Asset Management  Real Estate
Elite Asset Management
RE/MAX SELECT
8300 Carmel Ave. NE Ste. 203
Albuquerque NM 87122
(505)362-2005

zillow reviews