Real Estate Information

Elite Asset Management Team's Blog

Elite Asset Management Team

Blog

Displaying blog entries 91-100 of 240

May 2018 RE/MAX National Housing Report

by Elite Asset Management Team

Prices Rise 7.8 Percent, But Homes Selling Faster and Faster 


DENVER – In May, homes sold faster than at virtually any other time in the past decade, according to the latest RE/MAX National Housing Report. Low inventory and high demand in May cut Days on Market to 46, the second-lowest monthly number in the nearly 10-year history of the report.
 
May home sales topped April sales by 14.5%, and were down by 2.8% from May 2017. The median sales price of $251,673 was up 7.8%.
 
By comparison, homes averaged five more days on the market (51) in May 2017, 12 more days (58) in May 2016 and 18 more days (64) in 2015.
 
“Even with low inventory and the Federal Reserve raising interest rates, homes are going from ‘for sale’ to sold 28 percent faster than three years ago,” said RE/MAX CEO Adam Contos.
 
With 11 metro areas increasing the median sales price year-over-year by double digits, May is still a seller’s market, and homebuyers should expect to compete with other buyers when they are ready to make an offer on a home.
 
“Be prepared — that’s my message to potential homebuyers in this summer selling season,” added Contos. “Make sure you are pre-approved with a lender, try to make a clean offer with no contingencies and, if possible, consider offering favorable concessions to the seller such as a flexible closing date. Pairing today’s real estate technology with the guidance of a professional RE/MAX agent, can help you find the right home.”
 
Closed Transactions 
Of the 54 metro areas surveyed in May 2018, the overall average number of home sales increased 14.5% compared to April 2018 and decreased 2.8% compared to May 2017. Sixteen of the 54 metro areas experienced an increase in sales year-over-year, including, Burlington, VT, +14.2%, Boise, ID, +11.3%, Trenton, NJ, +7.7% and Anchorage, AK at +3.8%.
 
Median Sales Price – Median of 54 metro median prices
In May 2018, the median of all 54 metro Median Sales Prices was $251,673, up 2.1% from April 2018 and up 7.8% from May 2017. Three metro areas saw a year-over-year decrease in Median Sales Price: Trenton, NJ, -2.4%, Anchorage, AK, -1.2% and Hartford, CT, -0.7%. Eleven metro areas increased year-over-year by double-digit percentages, with the largest increases seen in San Francisco, CA, +19.3%, Boise, ID, +16.8%, Las Vegas, NV, +16% and Augusta, ME, +14%.
 
Days on Market – Average of 54 metro areas
The average Days on Market for homes sold in May 2018 was 46, down six days from the average in April 2018, and down five days from the May 2017 average. The metro areas with the lowest Days on Market were San Francisco, CA and Seattle, WA, at 19, Denver, CO, at 21 and Salt Lake City, UT, at 25. The highest Days on Market averages were in Augusta, ME, at 115, Hartford, CT, at 83, and New York, NY and Miami, FL at 82. Days on Market is the number of days between when a home is first listed in an MLS and a sales contract is signed.
 
Months Supply of Inventory – Average of 54 metro areas
The number of homes for sale in May 2018 was up 4% from April 2018, and down 9.5% from May 2017. Based on the rate of home sales in May, the Months Supply of Inventory remained unchanged from April 2018 at 2.5, and slightly decreased compared to 2.6 in May 2017. A 6.0-months supply indicates a market balanced equally between buyers and sellers. In May 2018, all 54 metro areas surveyed reported a months supply at or less than 6.0, which is typically considered a seller’s market. The markets with the lowest Months Supply of Inventory are in the west with San Francisco, CA, at 1.0 and Boise, ID, Denver, CO, and Seattle, WA, tied at 1.1.

Feel free to contact me and I can help break down exactly what these numbers mean for our local market and for your neighborhood. And lastly, If you or anyone you know is thinking of buying or selling a home - please call or email me. I'm here to help!

Peter Veres
Associate Broker, CRS,ABR,CLHMS,SRES

Elite Asset Management Team - RE/MAX Elite
www.PeteVeres.com
Cell: 505-362-2005
Office: 505-798-1000


Feel free to contact me and I can help break down exactly what these numbers mean for our local market and for your neighborhood. And lastly, If you or anyone you know is thinking of buying or selling a home - please call or email me. I'm here to help!

Peter Veres

Associate Broker,CRS,ABR,CLHMS,SRES

Elite Asset Management Team - RE/MAX Elite

www.PeteVeres.com

Cell: 505-362-2005

Office: 505-798-1000

Rent Still Rising According to Reports

by Elite Asset Management Team


If you’re renting your home you probably already know that rent has continued to rise since you first started renting. You’re already losing money by renting and not having home equity and with rent continually rising you’ll be losing a lot more in the long run.

From the 2018 first quarter median rent numbers from the Census Bureau, this graph shows rent increases from 1988 until today:

Based on this graph, you can see that rent has steadily risen over the past few decades. With this information you can somehow guess that it will still continue to rise. Consider buying a home. Lock in your monthly housing expense. Start building equity.

Talk to a realtor and find out what your options are. It doesn’t matter if you’re thinking of buying tomorrow or a few years from now, learn as much as you can. There may be options available for you today that might not be there when you finally decide to buy a home.

Meet with a realtor like Pete Veres, CRS – Certified Residential Specialist & ABR – Accredited Buyers Representative who can help you navigate thru the process and get the job done for you. Pete Veres has had over 25 years of Sales & Marketing experience, excellent negotiating skills and a superb track record.

You can contact him by calling or texting him at 505-362-2005 or by emailing him at [email protected].

He has a great website full of the latest information at www.NMElite.com

Thinking of Selling Your House On Your Own? It Could Cost You.

by Elite Asset Management Team


The current real estate market favors sellers and some homeowners might be thinking of selling their homes on their own which is also known as a For Sale By Owner (FSBO). They think that by going that route, they’ll be saving money by not having to get the services of a real estate agent.

Collateral Analytics made a study and found out that FSBOs don’t actually save any money and in some cases, it has cost them more by not getting the services of a real estate agent and having it listed with them.

In the study, they analyzed home sales in a variety of markets. The data showed that:

“FSBOs tend to sell for lower prices than comparable home sales, and in many cases below the average differential represented by the prevailing commission rate.”

Why would FSBOs net less money than if they had used an agent?

The study makes several suggestions:

  • “There could be systematic bias on the buyer side as well. FSBO sales might attract more strategic buyers than MLS sales, particularly buyers who rationalize lower-priced bids with the logic that the seller is “saving” a traditional commission. Such buyers might specifically search for and target sellers who are not getting representational assistance from agents.” In other words, ‘bargain lookers’ might shop FSBOs more often.
  • “Experienced agents are experts at ‘staging’ homes for sale” which could bring more money for the home.
  • “Properties listed with a broker that is a member of the local MLS will be listed online with all other participating broker websites, marketing the home to a much larger buyer population. And those MLS properties generally offer compensation to agents who represent buyers, incentivizing them to show and sell the property and again potentially enlarging the buyer pool.” If more buyers see a home, the greater the chances are that there could be a bidding war for the property.

In conclusion:

  1. They achieve lower prices when they go FSBO than similar homes that are sold by realtors who use the MLS,
  2. The data suggests the average price was near 6% lower for FSBO sales of similar properties.

America’s trusted voice on money, Dave Ramsey explains:

“Research has shown that, between mistakes, lack of negotiating skills, pricing errors and general exposure on the market, you’ll cost yourself more than the real estate commission…You’ll come out slightly better and with a lot less hassle if you use a top-shelf agent.”


Meet with a realtor like Pete Veres, CRS – Certified Residential Specialist, SRS – Senior Real Estate Specialist who can help you get your home sold. He can provide you with a Free Market analysis when you are ready. Pete Veres has had over 25 years of Sales & Marketing experience and excellent negotiating skills.

You can contact him by calling 505-362-2005 or by emailing him at [email protected].

Here are also some Free Sellers resources. VIP-Seller-Resources


April 2018 RE/MAX National Housing Report

by Elite Asset Management Team

Home Sales Increase 2.3% Despite Peaking Prices, Ever-Shrinking Inventory   


DENVER – Home sales increased 2.3% year-over-year in April 2018 in the face of record low inventory and the second-highest median sales price in the nine-year history of the RE/MAX National Housing Report. 
 
In April, San Francisco, CA reached a new benchmark surpassing $1 million for the metro area’s median sales price. Eight other metro areas including Las Vegas, NV, Seattle, WA and Boise, ID saw large double-digit price increases from just a year ago.
 
“If 2018 is like recent years, we’re only two months away from home prices peaking — we’re already seeing some impressive prices moving up in markets throughout the U.S.,” said RE/MAX CEO Adam Contos. “As we head into summer, we’ll watch several housing markers like home starts, mortgage applications and sales price to gauge the effect they’ll have on inventory across the country — the good news is that the rate of sales helps accommodate a shrinking inventory and buyers can still find opportunities.”
 
The $243,000 Median Sales Price was a record for April and was second only in report history to $245,000 in June 2017. In each of the last five years, June has produced the year’s highest Median Sales Price, with July or August posting the second-highest monthly price each year.
 
Notable metrics from this month’s RE/MAX National Housing Report:

  • Thirty-eight of the 53 markets in the report posted more sales than in April 2017, while the 2.5 months supply of inventory tied March as the lowest ever, in the history of the report
  • The average Days on Market in April was 52 — that’s five days less than April 2017 and a RE/MAX National Housing Report record for the month.

 
Closed Transactions 
Of the 53 metro areas surveyed in April 2018, the overall average number of home sales increased 3.6% compared to March 2018 and increased 2.3% compared to April 2017. Thirty-eight of the 53 metro areas experienced an increase in sales year-over-year including, Milwaukee, WI, 13.4%, Burlington, VT, 12.1%, Albuquerque, NM, 11.1%, and New Orleans, LA, at 9.1%.
 
Median Sales Price – Median of 53 metro median prices
In April 2018, the median of all 53 metro Median Sales Prices was $243,000, up 3.0% from March 2018 and up 7.5% from April 2017. Three metro areas saw a year-over-year decrease in Median Sales Price including, Trenton, NJ, -5.1%, Birmingham, AL, -3.0% and Wilmington/Dover, DE, -0.5%. Nine metro areas increased year-over-year by double-digit percentages, with the largest increases seen in Las Vegas, NV, 18%, Seattle, WA, 17%, Boise, ID, 15.8% and San Francisco, CA, 15.4%.
 
Days on Market – Average of 53 metro areas
The average Days on Market for homes sold in April 2018 was 52, down eight days from the average in March 2018, and down five days from the April 2017 average. The metro areas with the lowest Days on Market were San Francisco, CA, at 19, Seattle, WA, at 21, Denver, CO, at 23, and Las Vegas, NV, at 29. The highest Days on Market averages were in Augusta, ME, at 119, Burlington, VT, at 110 and Hartford, CT, at 91. Days on Market is the number of days between when a home is first listed in an MLS and a sales contract is signed.
 
Months Supply of Inventory – Average of 53 metro areas
The number of homes for sale in April 2018 was up 3.4% from March 2018, and down 11.3% from April 2017. Based on the rate of home sales in April, the Months Supply of Inventory remained at 2.5 from March 2018, and decreased compared to April 2017 at 2.8. A 6.0-months supply historically indicates a market that’s balanced equally between buyers and sellers. In April 2018, all 53 metro areas surveyed reported a months supply at or less than 6.0, which is typically considered a seller’s market. The markets with the lowest Months Supply of Inventory continue to be in the west with Boise, ID, Denver, CO, San Francisco, CA, and Seattle, WA, at 1.0.

Please note the name change to this month’s housing report. Beginning in May 2018, the title of the RE/MAX National Housing Report will reflect the month of MLS data being reported on in the report. For example, the April 2018 report reflects the April MLS data. 

Feel free to contact me and I can help break down exactly what these numbers mean for our local market and for your neighborhood. And lastly, If you or anyone you know is thinking of buying or selling a home - please call or email me. I'm here to help!

Peter Veres

Associate Broker, CRS,ABR,CLHMS,SRES

Elite Asset Management Team - RE/MAX Elite

www.PeteVeres.com

Cell: 505-362-2005

Office: 505-798-1000

Survey Says: Ages 50 Below Wants to Own a Home

by Elite Asset Management Team


According to the Survey of Consumer Expectations (SCE) by New York Federal Reserve, which has a wide range of topics including inflation, labor market, household finance, credit access and housing, a lot of people under 50 want to own their own home.

The question was, assuming you had the financial resources to do so, would you like to OWN instead of RENT your primary residence?

More than three quarters of people aged 50 below answered they would want to own a home rather than rent. Half of the people over 50 preferred the same.

Here’s a chart with the complete details.

They were also asked about the chances of them owning their own home and 66.4% of those under 50 said they were going to have their own home eventually. Some of the  people over 50 ,23% of them, didn’t want to own their own home.


It seems that according to the survey, most of the young people are still interested in buying.

Meet with a realtor like Pete Veres, CRS – Certified Residential Specialist & ABR – Accredited Buyers Representative who can help you navigate thru the process and get the job done for you. Pete Veres has had over 25 years of Sales & Marketing experience, excellent negotiating skills and a superb track record.

You can contact him by calling or texting him at 505-362-2005 or by emailing him at [email protected].

He has a great website full of the latest information at www.NMElite.com


Home Prices Are Increasing, But Why?

by Elite Asset Management Team

Home prices have been increasing and there are many unsubstantiated theories why it has been happening. Some say that lending standards are again becoming too lenient, while some are concerned that prices are again approaching boom peaks because of “irrational exuberance”. Both these theories are both untrue since data shows that lending standards are not being too lenient and prices are not at peak levels when they are adjusted for inflation.

The real reason prices are increasing is because of supply and demand. Whenever there is a limited supply of an item that is in high demand, prices increase.

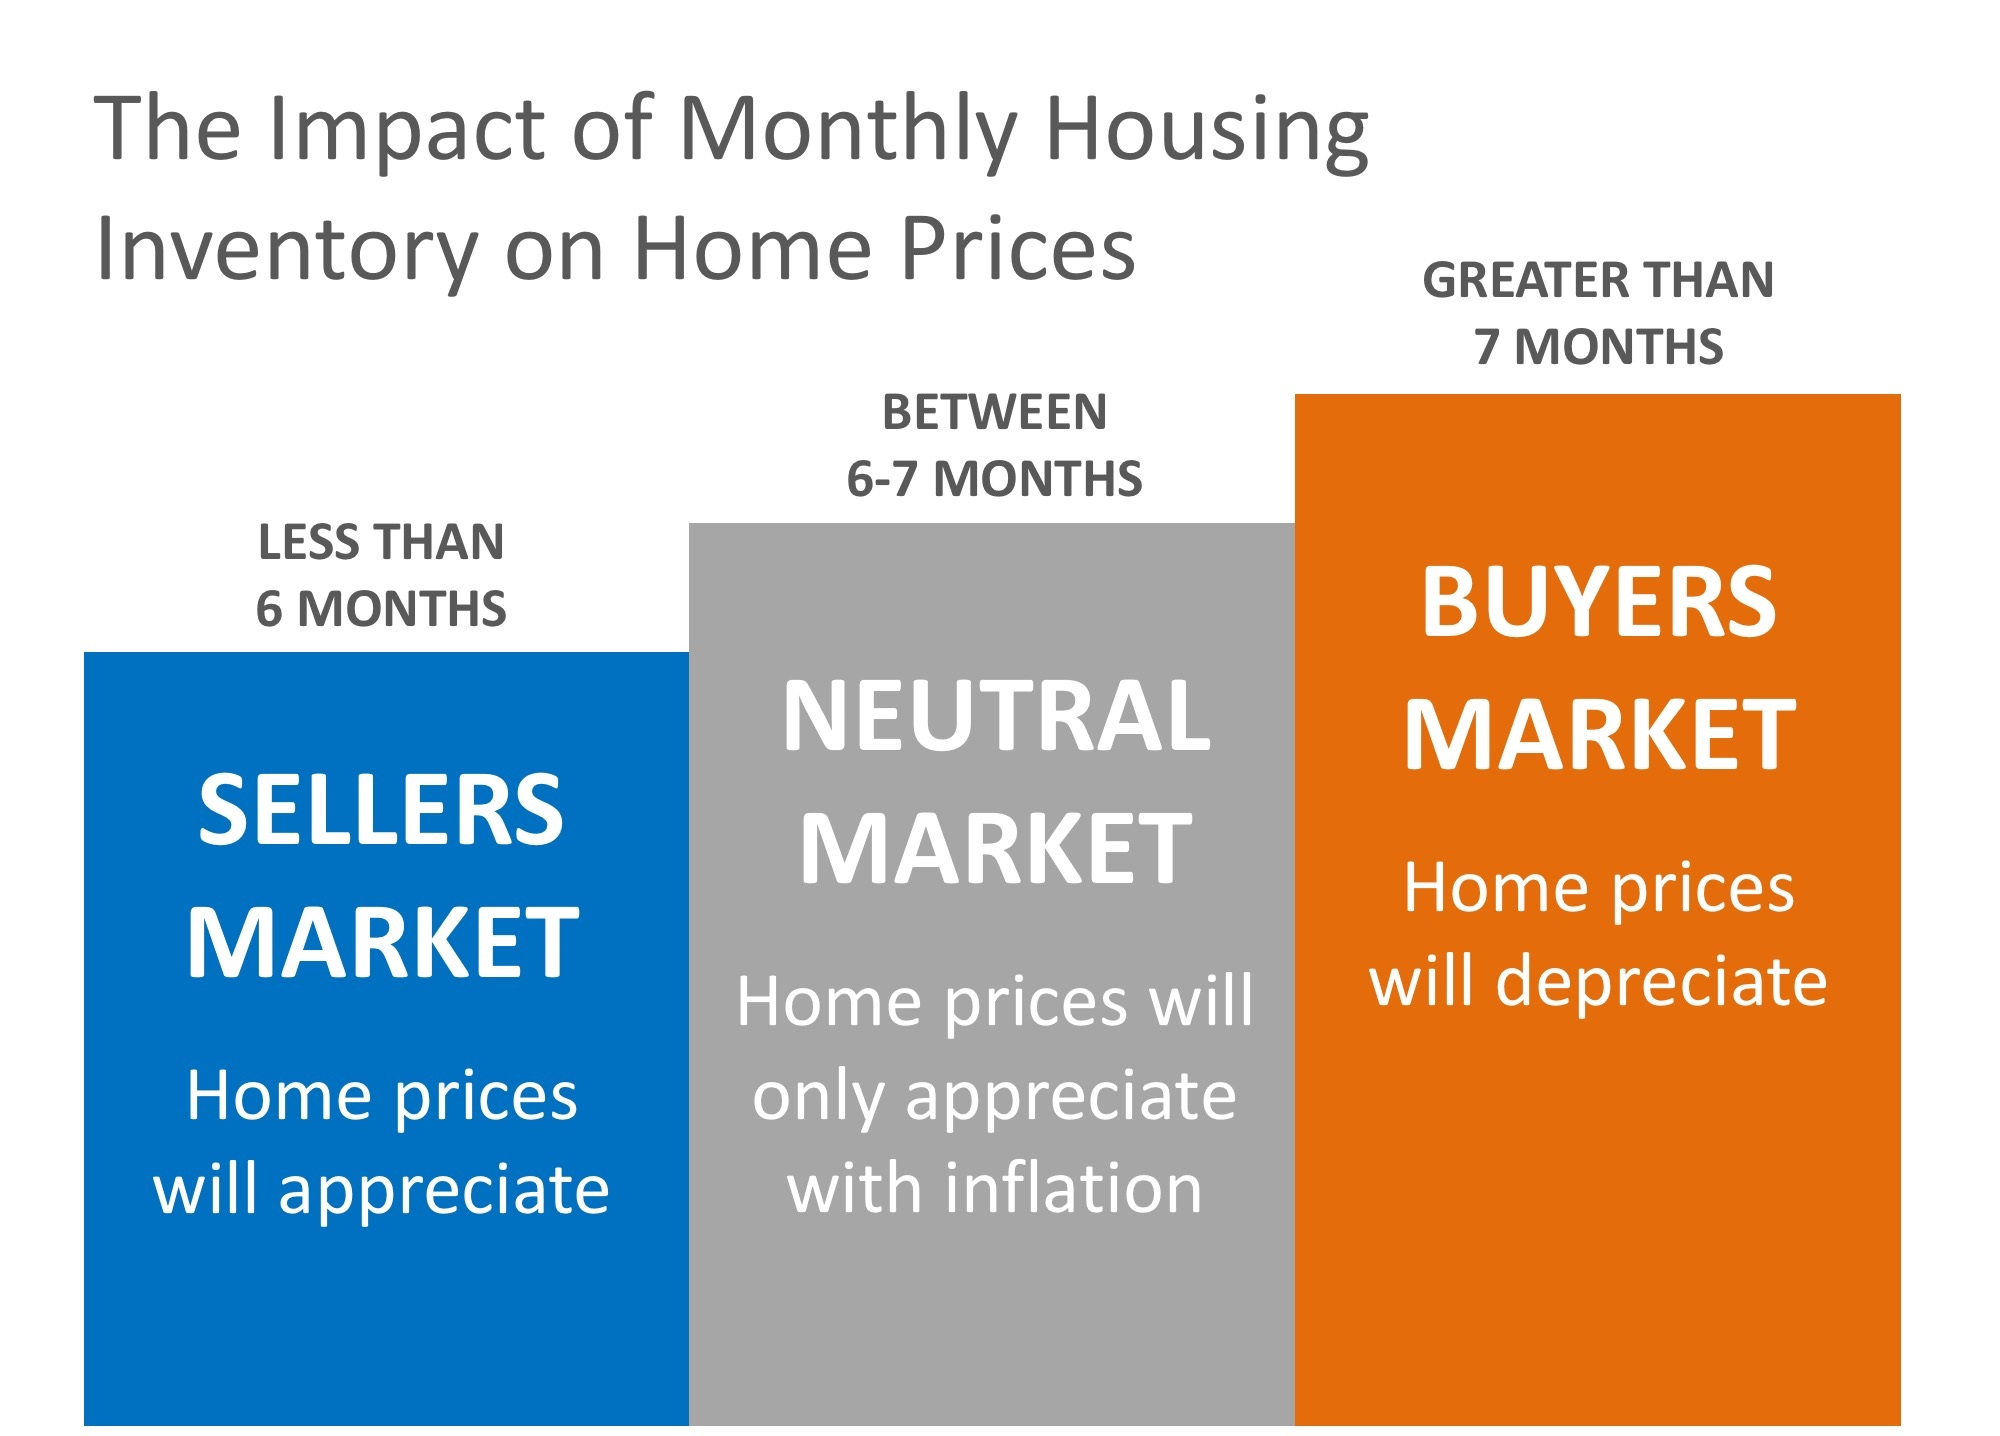
In real estate, it takes a six-month supply of existing salable inventory to maintain pricing stability. In most housing markets, anything less than six months will cause home values to appreciate and anything more than seven months will cause prices to depreciate.

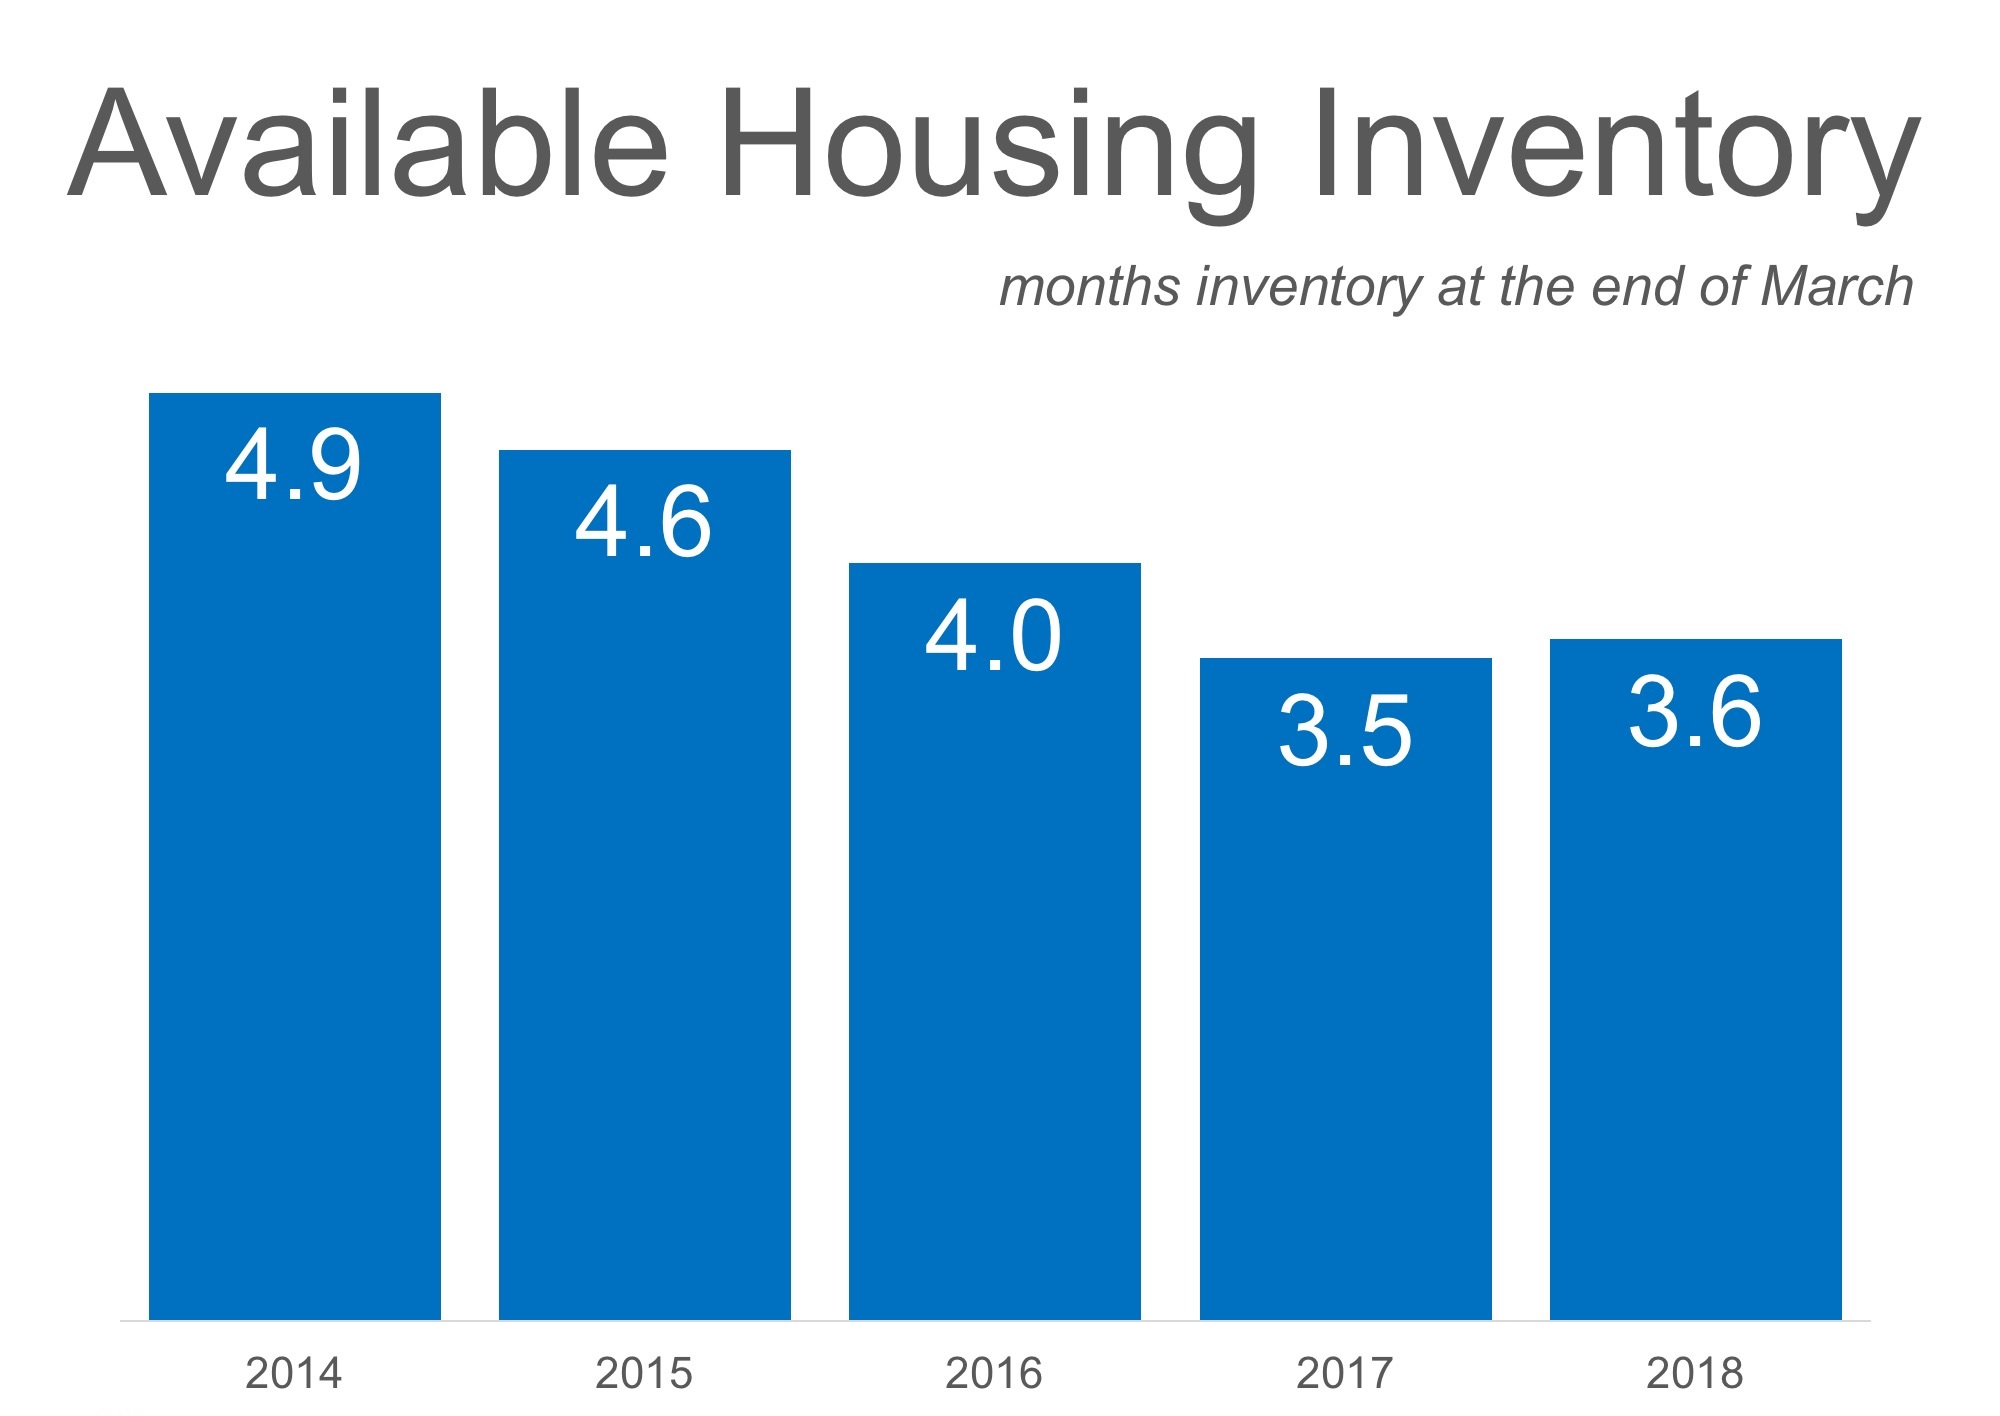
According to the Existing Home Sales Report from the National Association of Realtors (NAR), the monthly inventory of homes for sale has been below six months for the last five years.

As long as there more home buyers than home sellers, prices will continue to rise. Nothing out of the ordinary is happening. It’s just simple supply and demand.

Meet with a realtor like Pete Veres, CRS – Certified Residential Specialist & ABR – Accredited Buyers Representative who can help you navigate thru the process and get the job done for you. Pete Veres has had over 25 years of Sales & Marketing experience, excellent negotiating skills and a superb track record. He can also help you to get a  loan pre-approval at no cost.

You can contact him by calling or texting him at 505-362-2005 or by emailing him at [email protected]

He has a great website full of the latest information at www.NMElite.com


April 2018 National Housing Report

by Elite Asset Management Team

Rising Prices, Fewer Sales Driven by Record-Breaking Low Inventory    


DENVER – If you are looking for a new home, chances are you’re not finding many homes on the market. If you’re a seller, you have likely noticed the value of your home is rising — no matter what part of the country you live in.
 
According to the April 2018 RE/MAX National Housing Report, home prices continued to climb year-over-year for the 24th consecutive month in March, while home sales continued to decline for a fourth consecutive month, making it a seller’s market in most regions of the country.
 
“Homebuyers shouldn’t be discouraged by the record-breaking numbers — even with higher prices and closed transactions, this March marks the second-highest in sales in the history of the RE/MAX National Housing Report,” said RE/MAX CEO Adam Contos. “It’s more important than ever to work with an experienced RE/MAX agent who is invested and involved in their community. They are dialed into the nuances of a neighborhood, making your home search or sale easier and quicker.”
 
When the Months Supply of Inventory falls below six months, it’s a seller’s market, and all 54 metro areas surveyed for the monthly housing reported under six months of inventory. 
 
“We also look at the Days on Market as another indicator of tight inventory and the national average stands at 60 days,” said Contos. “That’s four days less than a year ago and another March record-breaker.”
 
Closed Transactions 
Of the 54 metro areas surveyed in March 2018, the overall average number of home sales increased +36.6% compared to February 2018 and decreased -5.3% compared to March 2017. Nine of the 54 metro areas experienced an increase in sales year-over-year including, Milwaukee, WI, +22%, Boise, ID, 7.3%, Albuquerque, NM, +6.7%; and Anchorage, AK, +3.8%.
 
Median Sales Price – Median of 54 metro median prices
In March 2018, the median of all 54 metro Median Sales Prices was $236,000, up +3.2% from February 2018 and up +4.9% from March 2017. Four metro areas saw a year-over-year decrease in Median Sales Price including, Anchorage, AK, -3.4%, Billings, MT, -1.1%, Trenton, NJ, -0.5%; and Manchester, NH, -.02%. Twelve metro areas increased year-over-year by double-digit percentages, with the largest increases seen in Boise, ID, +19.9%, San Francisco, CA, +19.4%; and Seattle, WA, and Las Vegas, NV, tied at +15.6%.

Days on Market – Average of 54 metro areas
The average Days on Market for homes sold in March 2018 was 60, down two days from the average in February 2018, and down four days from the March 2017 average. The metro areas with the lowest Days on Market were San Francisco, CA, at 20, Seattle, WA, at 28, Denver, CO, at 30; and San Diego, CA, at 31. The highest Days on Market averages were in Augusta, ME, at 131, Burlington, VT, at 115, Chicago, IL, at 97; and Hartford, CT, at 96. Days on Market is the number of days between when a home is first listed in an MLS and a sales contract is signed.
 
Months Supply of Inventory – Average of 54 metro areas

The number of homes for sale in March 2018 was down -0.5% from February 2018, and down -14.7% from March 2017. Based on the rate of home sales in March, the Months Supply of Inventory decreased to 2.5 from February 2018 at 3.1, as well as decreased compared to March 2017 at 2.7. A 6.0-months supply indicates a market balanced equally between buyers and sellers. In March 2018, all 54 metro areas surveyed reported a months supply less than 6.0, which is typically considered a balanced market. The markets with the lowest Months Supply of Inventory continue to be in the west with San Francisco, CA, at 0.7, Denver, CO, and Seattle, WA, both at 0.9; and Boise, ID, and Omaha, NE, at 1.1.

Feel free to contact me and I can help break down exactly what these numbers mean for our local market and for your neighborhood. And lastly, If you or anyone you know is thinking of buying or selling a home - please call or email me. I'm here to help!

Peter Veres

Associate Broker, CRS,ABR,CLHMS,SRES

Elite Asset Management Team - RE/MAX Elite

www.PeteVeres.com

Cell: 505-362-2005

Office: 505-798-1000

Interest Rates of Mortgage Steady

by Elite Asset Management Team

One of the most important things to understand when buying a home is the mortgage rates.

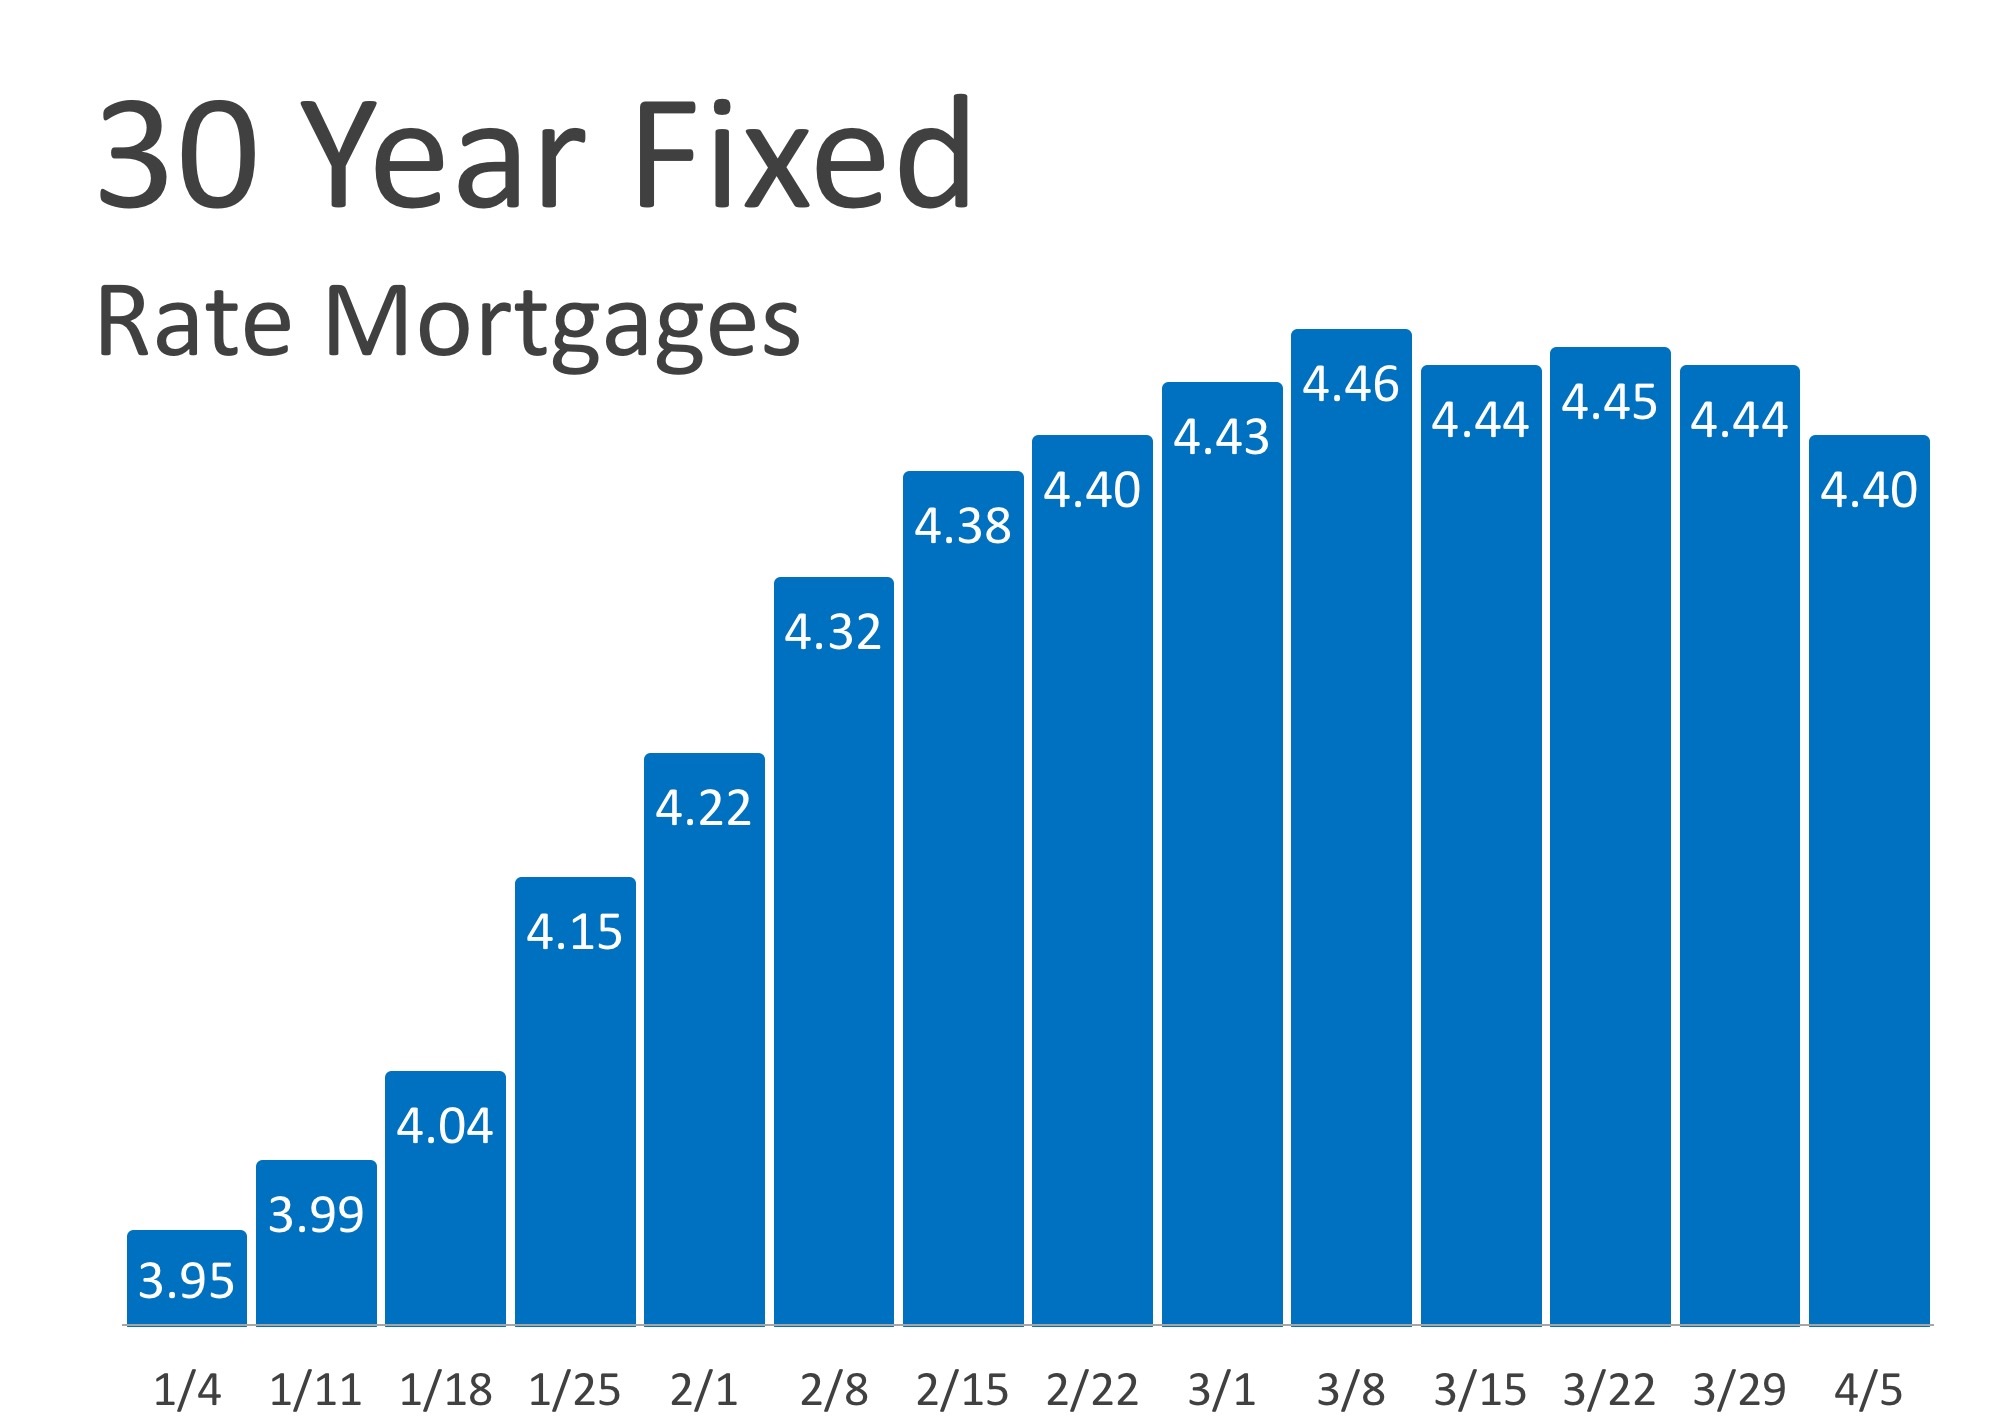
According to Freddie Mac’s Primary Mortgage Market Survey, in 2018, the difference in mortgage rates from January to April is .45%. January’s mortgage rates was at 3.95% and increase gradually through the first week of April to 4.40%.

This increase looks alarming, but if you look at the graph you’ll see that it has stayed steady for the past few months and has returned to the mortgage interest rates back in February.


If you’re looking to buy a home this spring, now is the best time to buy. With rates keeping steady, it is wise to get that rate locked in before prices go up even higher as predicted.

Every month, Freddie Mac, Fannie Mae, the Mortgage Bankers Association and the National Association of Realtors release their projections for where they believe mortgage rates will be in the coming months. If we take the average of what each of the four organizations is predicting for the second quarter, rates are expected to rise to about 4.48% by June.

That average climbs to 4.73% by the end of this year.

Don’t wait till the end of the year to buy. Rates are projected to increase and it will cost you more on your monthly payment. For every $250,000 you need to borrow to purchase your dream home, you will spend $49.21 more per month, $590.52 per year, and over $17,700 by the end of your 30-year mortgage.

And that’s just the impact of your interest rate going up!

Meet with a realtor like Pete Veres, CRS – Certified Residential Specialist & ABR – Accredited Buyers Representative who can help you navigate thru the process and get the job done for you. Pete Veres has had over 25 years of Sales & Marketing experience, excellent negotiating skills and a superb track record.

You can contact him by calling or texting him at 505-362-2005 or by emailing him at [email protected].

He has a great website full of the latest information at www.NMElite.com

February sales in Greater ABQ continue upward trend

by Elite Asset Management Team


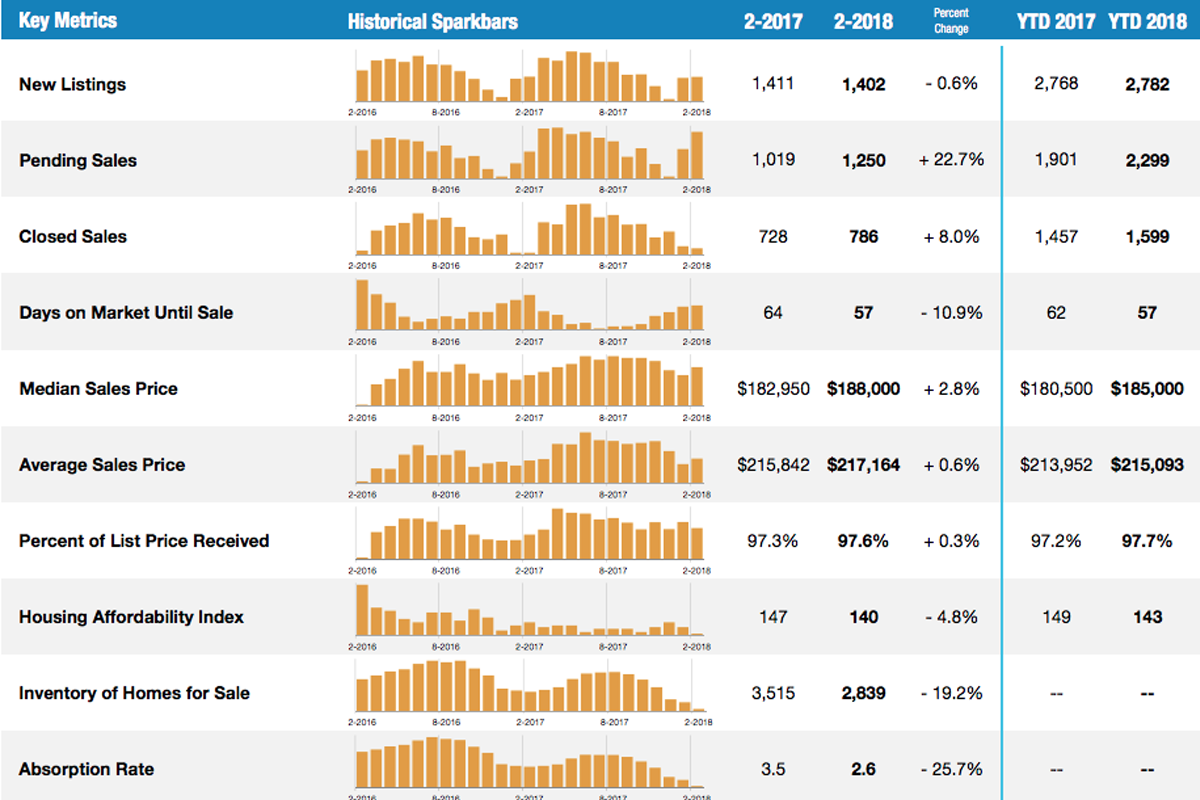
Sales activity in the Greater Albuquerque market areas saw Pending home sales exceed 1,000 for the second consecutive month, according to the Greater Albuquerque Association of REALTORS® (GAAR) with data from the Southwest Multiple Listing Service, Inc. (SWMLS). The 1,142 detached homes going under contract in February 2018 was a 22.4 percent increase over the same period last year and is the highest February month for Pending sales since 2006.

Pending sales of condos/townhomes for February 2018 notes a 25.6 percent increase over the same month last year. Once again, inventory of homes for sale in the Greater ABQ areas is down. Compared to February 2017, detached inventory shows an 18.2 percent drop to only 2,613 active listings, while attached homes were reduced 29.6 percent.

Both the average and median detached home prices increased in February. Compared to the same period in 2017, the median sales price increased 4.1 percent to $194,500 and the average sales price increased 0.8 percent to $225,342. While sales of homes in the $200,000 to $249,999 remain strong, February marked a notable increase in homes sold in both the $140,000 to $149,999 range and the $160,000 to $179,999 range.

The ratio of Sales Price compared to Final Listing Price for detached homes increased 0.2 percent to 97.6 percent for the month of February. Condo/Townhome sales showed an increase of 0.3 percent to 97.3 percent for the same time period.

“Homes selling in February retained 97% of their final listing price,” said Danny Wm. Vigil, 2018 President of the Greater Albuquerque Association of REALTORS®. He added, “Using a REALTOR® in today’s market has never been more important in helping sellers get to the best price point to maximize their sale profits” The full report for February market statistics is available by clicking here, or going to GAAR.com and clicking on Market Statistics.

Report is from GAAR.com

March 2018 RE/MAX National Housing Report

by Elite Asset Management Team


Inventory Limits February Home Sales While Pushing Up Prices

DENVER – One word sums up February home sales across the country – inventory. The lack of homes for sale continues to be the key factor as February marks the third consecutive month of year-over-year declines in home sales, coupled with quick sales and record prices.

According to the March RE/MAX National Housing Report, home sales dropped 0.2% from February 2017, while the Days on Market average of 62 days was the lowest of any February in the report’s nine-year history.
 
“We shared our outlook of the real estate market in the new year and it seems that even two months into 2018 we’re already seeing records break,” said RE/MAX CEO Adam Contos. “The February 2018 median sales price of $228,700 marks the 22nd consecutive month of year-over-year price increases.”
 
The Months Supply of Inventory was 3.1 – also a RE/MAX National Housing Report February record – and underscored an average decline in inventory of 13.7% among the 52 markets reporting.

“While the hot markets like Denver and San Francisco continue to see low supplies of inventory, we’re also watching more homebuyers migrate into unexpected markets,” added Contos. “In one year, Billings, Montana, saw a 59 percent increase in home sales, along with Boise, Idaho, with a 25 percent increase in sales.”
 
Out of 52 markets, 18 metro areas saw double-digit percentage increases in median sales price year-over-year. While only two metros saw a year-over-year decrease in median sales price – Albuquerque, NM, and Burlington, VT.

Closed Transactions 
Of the 52 metro areas surveyed in February 2018, the overall average number of home sales increased +3.5% compared to January 2018 and decreased -0.2% compared to February 2017. Twenty-six of the 52 metro areas experienced an increase in sales year-over-year including, Billings, MT, +59.2%, Boise, ID, +25.4%, Burlington, VT, +20.4%, Milwaukee, WI, +19.6% and Richmond, VA, at +13.2%

Median Sales Price – Median of 52 metro median prices
In February 2018, the median of all 52 metro Median Sales Prices was $228,700, up +2.3% from January 2018 and up +8.1% from February 2017. Two metro areas saw a year-over-year decrease in Median Sales Price, Albuquerque, NM, -0.2% and Burlington, VT, -5.2%. Eighteen metro areas increased year-over-year by double-digit percentages, with the largest increases seen in Las Vegas, NV, +15.6%, San Francisco, CA, +15.5%, Seattle, WA, +15.4%, Pittsburgh, PA, +14.8% and Minneapolis, MN, +13.3%.

Days on Market – Average of 52 metro areas
The average Days on Market for homes sold in February 2018 was 62, up two days from the average in January 2018, and down six days from the February 2017 average. The metro areas with the lowest Days on Market were Las Vegas, NV, and San Diego, CA, at 36, Denver, CO, and Nashville, TN, both at 35, and Seattle, WA, at 33. The highest Days on Market averages were in Wilmington, DE, at 117, Wichita, KS, at 101, Washington, D.C., at 99 and Tulsa, OK, at 93. Days on Market is the number of days between when a home is first listed in an MLS and a sales contract is signed.
 
Months Supply of Inventory – Average of 52 metro areas
The number of homes for sale in February 2018 was down -1.0% from January 2018, and down -13.7% from February 2017. Based on the rate of home sales in February, the Months Supply of Inventory decreased to 3.1 from January 2018 at 3.4, as well as decreased compared to February 2017 at 3.6. A 6.0-months supply indicates a market balanced equally between buyers and sellers. In February 2018, 48 of the 52 metro areas surveyed reported a months supply at or less than 6.0, which is typically considered a seller’s market. The metro areas that saw a months supply above 6.0, which is typically considered a buyer’s market, were Miami, FL, at 7.0, New Orleans, LA, at 6.8, Augusta, ME, at 6.5 and Burlington, VT, at 6.4. The markets with the lowest Months Supply of Inventory continued to be in the west with Denver, CO, and Seattle, WA, at 1.0 and San Francisco, CA, at 1.1.

Feel free to contact me and I can help break down exactly what these numbers mean for our local market and for your neighborhood. And lastly, If you or anyone you know is thinking of buying or selling a home - please call or email me. I'm here to help!

Peter Veres

Associate Broker, CRS,ABR,CLHMS,SRES

Elite Asset Management Team - RE/MAX Elite

www.PeteVeres.com

Cell: 505-362-2005

Office: 505-798-1000


Feel free to contact me and I can help break down exactly what these numbers mean for our local market and for your neighborhood. And lastly, If you or anyone you know is thinking of buying or selling a home - please call or email me. I'm here to help! 
Peter Veres
Associate Broker, CRS,ABR,CLHMS,SRES
Elite Asset Management Team - RE/MAX Elite
www.PeteVeres.com
Cell: 505-362-2005
Office: 505-798-10

Displaying blog entries 91-100 of 240

Syndication

Categories

Archives

Contact Information

Photo of Elite Asset Management  Real Estate
Elite Asset Management
RE/MAX SELECT
8300 Carmel Ave. NE Ste. 203
Albuquerque NM 87122
(505)362-2005

zillow reviews