RE/MAX National Housing Report on MLS Data from 53 Metro Areas
DENVER (Jan. 19, 2016) – After two consecutive months with falling home sales, December came back
very strong with 6.1% more sales than one year ago. In
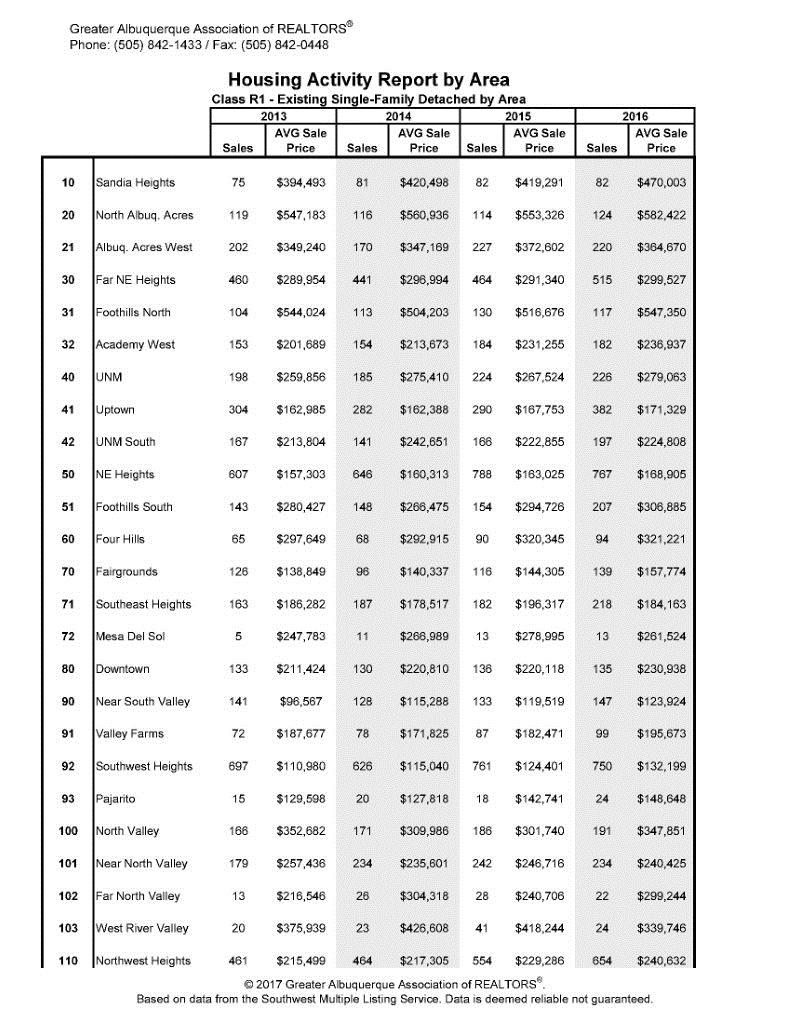
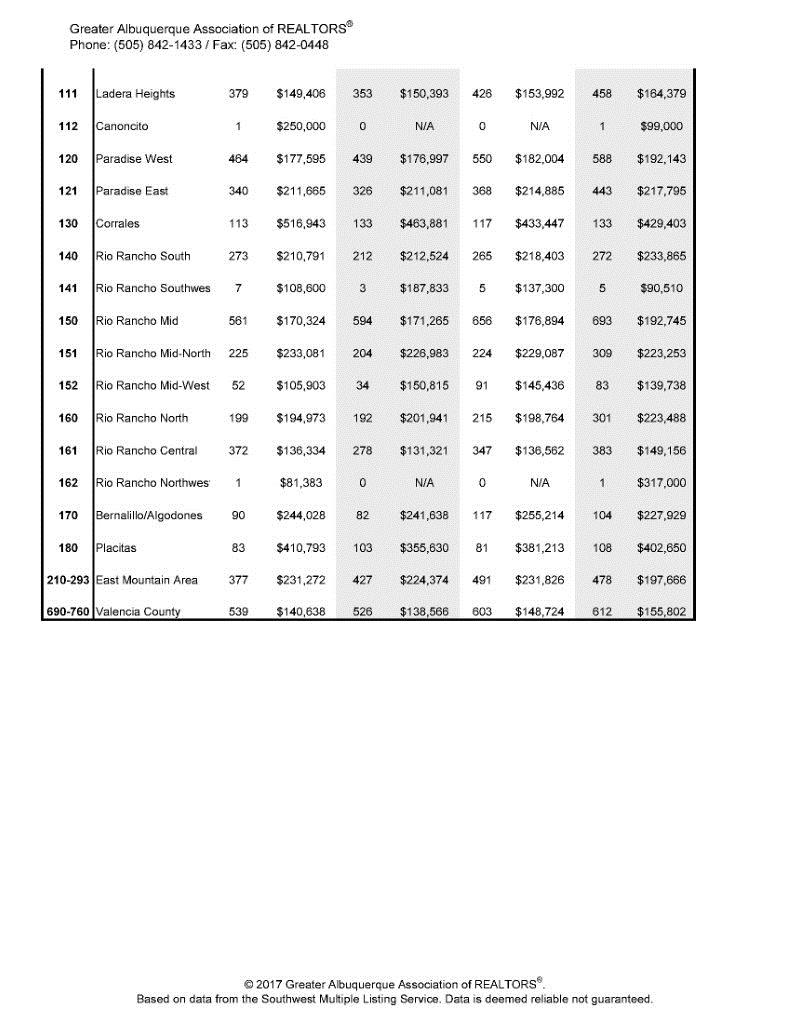
Albuquerque we were at +18 % over last year.
On a month-over-month basis, December sales were much higher than expected at 22.5%. In all of 2015,
nine months saw home sales higher than the same month one year ago. December appeared to
continue the trend of moderating home prices, with a year-over year gain of 5.3% while the 2015
average was 7.6%. The median price of all homes sold in December was $206,000. The Albuquerque
median price was $175,500.00. The inventory of homes for sale remains very tight in many metros
across the country, at a level that is 14.2% lower than December 2014. At the rate of home sales in
December, the national Month’s Supply of Inventory was 4.9, down from 5.7 one year ago. To view the
Greater Albuquerque Market Update click here: December 2015 ABQ Area Real Estate Update
“It’s possible that the TRID closing rule implementation caused November transactions to dip lower than
normal, but now we see December bouncing back much stronger than the seasonal average. Perhaps
many closings were simply pushed forward a month. But it’s nice to see the year end on an upbeat note,
with sales significantly greater than the previous year. Overall, 2015 goes into the record books as a very
good year for residential real estate,” said Dave Liniger, RE/MAX CEO, Chairman of the Board and Co-
Founder.
“2015 bookends with the same story we’ve heard throughout the year - a housing supply that trails the
demand, continuing to push values higher,” added Quicken Loans Chief Economist Bob Walters. “The
market could benefit from homeowners taking advantage of the equity they are building, and make
their home available to the many eager buyers. This could give buyers a chance to find the home they
have been waiting for.”
Closed Transactions – Year-over-year change
In the 53 metro areas surveyed in December, the average number of home sales increased 22.5% from
sales in November, and were also 6.1% higher than the number of sales one year ago. Since January,
year-over-year sales have increased an average of 4.8% each month. For the last eight years, the
average seasonal increase in sales from November to December has been 6.9%. This December’s
month-over month increase was nearly four times that amount. In December, 43 of the 53 metro areas
surveyed reported higher sales on a year-over-year basis with 14 experiencing double-digit increases,
such as Boise, ID +23.8%, Manchester, NH +22.9%, Las Vegas, NV +18.7%, Albuquerque, NM +18.3%, St.
Louis, MO +14.3% and Portland, OR +13.9%.
Median Sales Price
The Median Sales Price for all homes sold in the month of December was $206,000, up 2.0% from
November. On a year-over-year basis, the Median Sales Price has now risen for 47 consecutive months,
but December’s increase of 5.3% is less than the average of 7.6% for each month in 2015. Even though
prices have been moderating, a low inventory supply continues to pressure prices. Among the 53 metro
areas surveyed in November, 47 reported higher prices than last year with 12 rising by double-digit
percentages. Metropolitan areas with the highest percentage increases are Des Moines, IA +19.7%,
Fargo, ND +19.3%, Nashville, TN +14.6%, San Francisco, CA +14.4%, Orlando, FL +12.2% and Omaha, NE
+11.8%.
Days on Market – Average of 53 metro areas
In December, the average Days on Market for all homes sold was 67, up 2 days from the average in
November, but 6 days lower than the average in December 2014. December becomes the 33rd
consecutive month with a Days on Market average of 80 or less. In the two markets with the lowest
inventory supply, San Francisco and Denver, Days on Market was 32 and 35 respectively. Only three
metro areas had a Days on Market average of 100 or greater, Des Moines, IA 101, Chicago, IL 110 and
Augusta, ME with a 145-day average. Days on Market is the number of days between when a home is
first listed in an MLS and a sales contract is signed.
Month’s Supply of Inventory – Average of 53 metro areas
The number of homes for sale in December was 12.5% less than in November and 14.2% less than in
December last year. The average loss of inventory on a year-over-year basis for 2015 was 12.2%. Based
on the rate of home sales in December, the Month’s Supply of Inventory was 4.9, about the same as the
5.0 average in November, but lower than the 5.7 average in December of 2014. A 6.0 Month’s Supply
indicates a market balanced equally between buyers and sellers. The highest month supply was seen in
Augusta, ME at 14.1. Three metros had a supply less than 2 months, San Francisco with 1.1, Denver, CO
1.8 and Seattle at 1.9.
RE/MAX National Housing Report on MLS Data from 53 Metro Areas
DENVER (Jan. 19, 2016) – After two consecutive months with falling home sales, December came back very strong with 6.1% more sales than one year ago. In Albuquerque we were at +18 % over last year. On a month-over-month basis, December sales were much higher than expected at 22.5%. In all of 2015, nine months saw home sales higher than the same month one year ago. December appeared to continue the trend of moderating home prices, with a year-over year gain of 5.3% while the 2015 average was 7.6%. The median price of all homes sold in December was $206,000. The Albuquerque median price was $175,500.00. The inventory of homes for sale remains very tight in many metros across the country, at a level that is 14.2% lower than December 2014. At the rate of home sales in December, the national Month’s Supply of Inventory was 4.9, down from 5.7 one year ago. To view the Greater Albuquerque Market Update click here: December 2015 ABQ Area Real Estate Update
“It’s possible that the TRID closing rule implementation caused November transactions to dip lower than normal, but now we see December bouncing back much stronger than the seasonal average. Perhaps many closings were simply pushed forward a month. But it’s nice to see the year end on an upbeat note, with sales significantly greater than the previous year. Overall, 2015 goes into the record books as a very good year for residential real estate,” said Dave Liniger, RE/MAX CEO, Chairman of the Board and Co-Founder.
“2015 bookends with the same story we’ve heard throughout the year - a housing supply that trails the demand, continuing to push values higher,” added Quicken Loans Chief Economist Bob Walters. “The market could benefit from homeowners taking advantage of the equity they are building, and make their home available to the many eager buyers. This could give buyers a chance to find the home they have been waiting for.”
Closed Transactions – Year-over-year change
In the 53 metro areas surveyed in December, the average number of home sales increased 22.5% from sales in November, and were also 6.1% higher than the number of sales one year ago. Since January, year-over-year sales have increased an average of 4.8% each month. For the last eight years, the average seasonal increase in sales from November to December has been 6.9%. This December’s month-over month increase was nearly four times that amount. In December, 43 of the 53 metro areas surveyed reported higher sales on a year-over-year basis with 14 experiencing double-digit increases, such as Boise, ID +23.8%, Manchester, NH +22.9%, Las Vegas, NV +18.7%, Albuquerque, NM +18.3%, St. Louis, MO +14.3% and Portland, OR +13.9%.
Median Sales Price
The Median Sales Price for all homes sold in the month of December was $206,000, up 2.0% from November. On a year-over-year basis, the Median Sales Price has now risen for 47 consecutive months, but December’s increase of 5.3% is less than the average of 7.6% for each month in 2015. Even though prices have been moderating, a low inventory supply continues to pressure prices. Among the 53 metro areas surveyed in November, 47 reported higher prices than last year with 12 rising by double-digit percentages. Metropolitan areas with the highest percentage increases are Des Moines, IA +19.7%, Fargo, ND +19.3%, Nashville, TN +14.6%, San Francisco, CA +14.4%, Orlando, FL +12.2% and Omaha, NE +11.8%.
Days on Market – Average of 53 metro areas
In December, the average Days on Market for all homes sold was 67, up 2 days from the average in November, but 6 days lower than the average in December 2014. December becomes the 33rd consecutive month with a Days on Market average of 80 or less. In the two markets with the lowest inventory supply, San Francisco and Denver, Days on Market was 32 and 35 respectively. Only three metro areas had a Days on Market average of 100 or greater, Des Moines, IA 101, Chicago, IL 110 and Augusta, ME with a 145-day average. Days on Market is the number of days between when a home is first listed in an MLS and a sales contract is signed.
Month’s Supply of Inventory – Average of 53 metro areas
The number of homes for sale in December was 12.5% less than in November and 14.2% less than in December last year. The average loss of inventory on a year-over-year basis for 2015 was 12.2%. Based on the rate of home sales in December, the Month’s Supply of Inventory was 4.9, about the same as the 5.0 average in November, but lower than the 5.7 average in December of 2014. A 6.0 Month’s Supply indicates a market balanced equally between buyers and sellers. The highest month supply was seen in Augusta, ME at 14.1. Three metros had a supply less than 2 months, San Francisco with 1.1, Denver, CO 1.8 and Seattle at 1.9.


