Real Estate Information Archive

Blog

Displaying blog entries 81-90 of 240

Buying a Home? Do You Know the Lingo?

by Elite Asset Management Team


Buying A Home? Do You Know the Lingo? 
To start you on your path with confidence, we have 
compiled a list of some of the most common terms 
used when buying a home. 
Appraisal - A professional analysis used to estimate the value 
of the home. A necessary step in validating the home's worth to 
you & your lender to secure financing. 
Closing Costs - The cost to complete the real estate 
transaction. Paid at closing, they include: points, taxes, title 
insurance, financing costs, items that must be prepaid or 
escrowed. Ask your lender for a complete list of closing cost items. 
Credit Score - A number ranging from 300-850, that is based 
on an analysis of your credit history. Helps lenders determine the 
likelihood that you'll repay future debts. 
Down Payment - Down payments are typically 3-20% of the 
purchase price of the home. 0% down programs also exist, ask 
your lender for more information. 
Mortgage Rate - The interest rate you pay to borrow money to 
buy your house. The lower the rate, the better. 
Pre-Approval Letter - A letter from a lender indicating that 
you qualify for a mortgage of a specific amount. 
Real Estate Professional - An individual who provides services 
in buying & selling homes. Real estate professionals are there to 
help you through the confusing paperwork, find your dream home, 
negotiate any of the details that come up, and to help you know 
exactly what's going on in the housing market. 
The best way to ensure that your home-buying process is 
a confident one is to find a real estate pro who will guide 
you through every aspect of the transaction with 
'the heart of a teacher', putting your family's needs first. 


To start you on your path with confidence, we have compiled a list of some of the most common terms used when buying a home. 

Appraisal - A professional analysis used to estimate the value of the home. A necessary step in validating the home's worth to you & your lender to secure financing. 

Closing Costs - The cost to complete the real estate transaction. Paid at closing, they include: points, taxes, title insurance, financing costs, items that must be prepaid or escrowed. Ask your lender for a complete list of closing cost items. 

Credit Score - A number ranging from 300-850, that is based on an analysis of your credit history. Helps lenders determine the likelihood that you'll repay future debts. 

Down Payment - Down payments are typically 3-20% of the purchase price of the home. 0% down programs also exist, ask your lender for more information. 

Mortgage Rate - The interest rate you pay to borrow money to buy your house. The lower the rate, the better. Pre-Approval Letter - A letter from a lender indicating that you qualify for a mortgage of a specific amount. 

Real Estate Professional - An individual who provides services in buying & selling homes. Real estate professionals are there to help you through the confusing paperwork, find your dream home, negotiate any of the details that come up, and to help you know exactly what's going on in the housing market. 

The best way to ensure that your home-buying process is a confident one is to find a real estate pro who will guide you through every aspect of the transaction with 'the heart of a teacher', putting your family's needs first. 

Meet with a realtor like Pete Veres, CRS – Certified Residential Specialist & ABR – Accredited Buyers Representative who can help you navigate thru the process and get the job done for you. Pete Veres has had over 25 years of Sales & Marketing experience, excellent negotiating skills and a superb track record.

You can contact him by calling or texting him at 505-362-2005 or by emailing him at [email protected].


He has a great website full of the latest information at www.NMElite.com

Are We About to Enter a Buyers' Market?

by Elite Asset Management Team


Home sales are below last year’s levels, home values are appreciating at a slower pace, and there are reports showing purchasing demand softening. This has some thinking we may be entering a buyers’ market after sellers have had the upper hand for the past several years. Is this really happening?

The market has definitely softened. However, according to two chief economists in the industry, we are a long way from a market that totally favors the purchaser:

Dr. Svenja Gudell, Zillow Chief Economist:

“These seller challenges don’t indicate we’re suddenly in a buyers’ market – we don’t expect market conditions to shift decidedly in favor of buyers until 2020 or later. But buyers certainly are starting to balk at the rapid rise in prices and home values are starting to grow at a less frenetic pace.”

Danielle Hale, Chief Economist of realtor.com:

“The signs are pointing to a market that’s shifting toward buyers. But, in most places, we’re still a long way from a full reversal.”

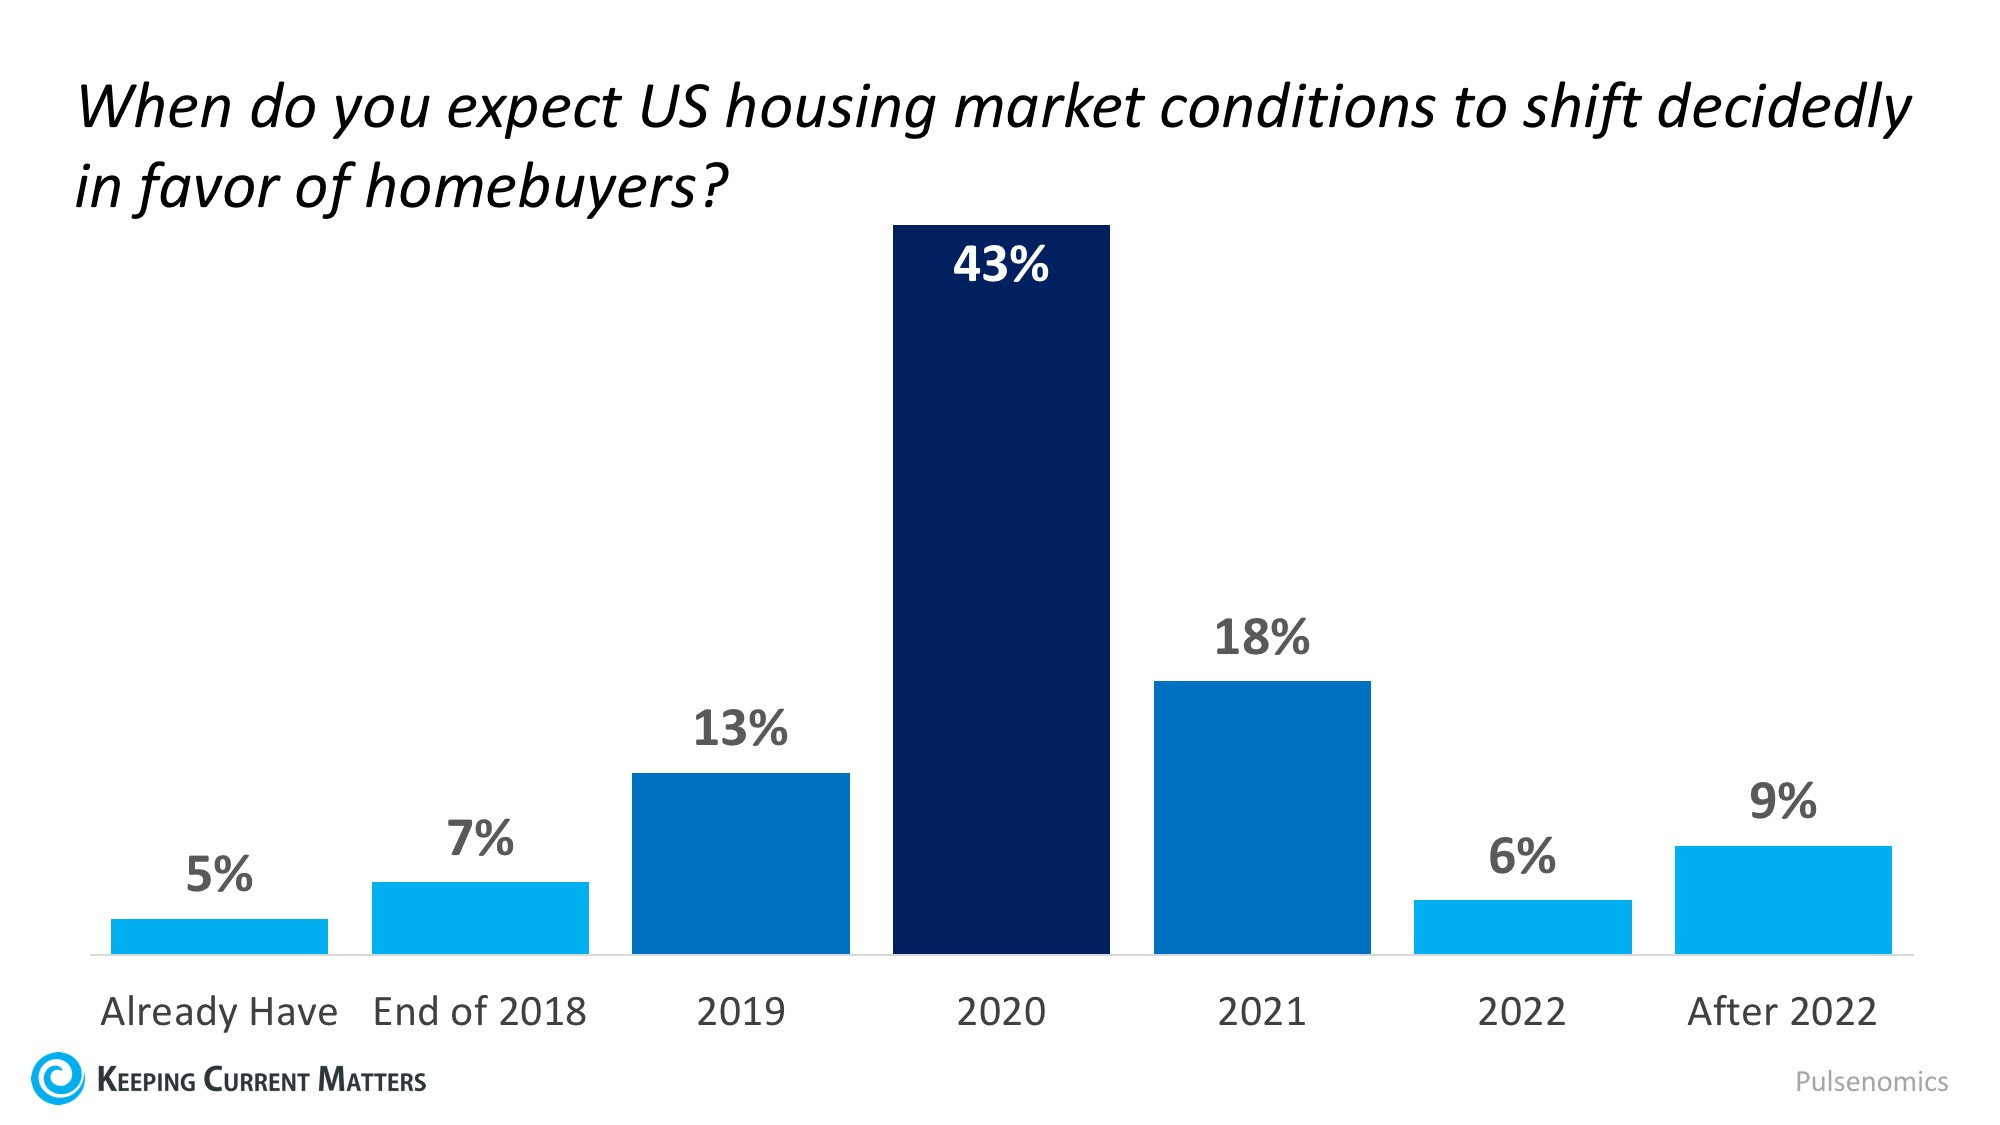
In addition, Pulsenomics Inc. recently surveyed over one hundred economists, real estate experts, and investment & market strategists and asked this question:

“When do you expect U.S. housing market conditions to shift decidedly in favor of homebuyers?”

Only 5% said the market has already shifted. Here are the rest of the survey results:


Bottom Line

The market is beginning to normalize but that doesn’t mean we will quickly shift to a market favoring the buyer. We believe Ivy Zelman, author of the well-respected ‘Z’ Report,best explained the current confusion:

“With the rate of home price appreciation starting to decelerate alongside the uptick in inventory…we expect significant debate about whether this is a bullish or bearish sign.

In our view, the short-term narrative will probably be confusing, but more sustainable growth and affordability will likely be the end result.”


Meet with a realtor like Pete Veres, CRS – Certified Residential Specialist & ABR – Accredited Buyers and Seller Representative who can help you navigate thru the process and get the job done for you. He can provide you with a Free Market analysis when you are ready. Pete Veres has had over 25 years of Sales & Marketing experience, excellent negotiating skills and a superb track record.

You can contact him by calling or texting him at 505-362-2005 or by emailing him at [email protected].

He has a great website full of the latest information at www.NMElite.com

Here are also some Free Sellers resources. VIP-Seller-Resources


Meet with a realtor like Pete Veres, CRS – Certified Residential Specialist & ABR – Accredited Buyers and Seller Representative who can help you navigate thru the process and get the job done for you. He can provide you with a Free Market analysis when you are ready. Pete Veres has had over 25 years of Sales & Marketing experience, excellent negotiating skills and a superb track record.


You can contact him by calling or texting him at 505-362-2005 or by emailing him at [email protected].


He has a great website full of the latest information at www.NMElite.com


Here are also some Free Sellers resources. VIP-Seller-Resources

Your Home Isn’t Selling? These Reasons Could Be Why.

by Elite Asset Management Team


Your home has been up for sale for quite some time. You were hopeful for a quick sale, but it didn’t happen. It has been months with no offers on the table. It can be really frustrating, but understanding why it’s not selling is a great place to start to finally getting your home sold.

So, why isn’t your home selling?

  1. Overvalue. You may have overvalued your property. Your home must be priced right at market for it to get offers. Comparing your home to similar homes that have recently sold in your neighborhood is one way to find out your home’s estimated value. A good realtor will be able to get the correct value for you. Try to avoid pricing a bit high saying we can always come down.
  2. Listing lacks presentation. A listing has to have a good description with beautiful photos of the interior and exterior. Highlight important stuff like the unique features of your home. Work with your realtor in creating an excellent presentation.
  3. Always at Showings. You should not be at home when it is shown to people. This could add pressure to the buyers and could ruin the chances of getting your home sold.
  4. Not Negotiating Properly. When selling your home, you have to be open to negotiations. One reason why home sellers don’t negotiate is that they’re too attached to their homes. Negotiate for the right price and get your home sold. Even if a low offer comes in try to make it a win, win. Any offer is a starting point.
  5. A Dirty House. Your house has to be clean. Period! A clean house is inviting and fresh. Have your home professionally cleaned to make sure potential homebuyers see your home at its best. Air fresheners are a plus but don’t over power on the scents.
  6. No Staging. Have you moved already? If you have, you have to consider staging your home. Adding furniture and decorations to your home will make it look good for potential buyers. It gives it warmth and the home will be more appealing to the buyers. It is a proven fact that staged homes sell faster and for a higher price that vacant homes.
  7. Personal Items. You have to make sure your home is free of your family photos and other personal items. The goal is to let the potential buyers see themselves living in the home.
  8. Personalized Improvements. You may have done something to your home that others may not like and this could be preventing the sale. It could be something like the color of your walls, the built in cabinets with weird carvings, and a lot more. You may want to have these adjusted to better suit the potential buyers. Ask you realtor for their assistance or even higher a professional stager.
  9. Clutter. Clutter isn’t good when selling a home as it makes the room look smaller. Potential buyers may shy away at the site of clutter so be sure to minimize or de-clutter completely.
  10. Too many repairs needed. If your home is in need of a lot of repairs, most of the buyers are going to look the other way. The best thing to do is get the small items done, especially those visible to the eye. Also, be prepared for repairs after having all the home inspections completed.
  11. Realtor. Choosing a good realtor is very important. Select a highly qualified agent with good experience, a good track record and good credentials. A good start is selecting a CRS – Certified Residential Specialist.  Also note their presentation skills when you interview. If they can’t present themselves properly, how will they present your home?

Knowing these issues can definitely set you on the right path to getting your home sold. You wouldn’t be reading this if you have a good realtor or if you didn’t need one. Get a good realtor. It really makes a huge difference. If you are local in the Greater Albuquerque Area visit www.TopAbqAgent.com

RE/MAX National Housing Report for August 2018

by Elite Asset Management Team


Home Sales Decline 1% as Inventory, Prices Level Out


DENVER – The RE/MAX National Housing Report for August 2018 shows increasing home prices, low inventory and a reduction in days on market. These combined factors made August 2018 the sixth time this year that home sales lagged behind last year’s pace—but only slightly at -1.1%.
 
Home prices rose by 3.7% over August 2017, much lower than the year-over-year price increase of 5.4% from August 2016 to August 2017. In fact, the past three months of 2018 have trailed 2017’s rate of price growth year-over-year—compare that to four of the first five months of 2018 when year-over-year price increases easily topped those posted in 2017.
 
The Median Sales Price of $248,500 marked the 29th consecutive month of year-over-year price increases.
 
Even though active inventory dropped for the 118th consecutive month, the decline of 5.4% from August 2017 marked the smallest year-over-year decrease since August 2014. In addition, the August 2018 inventory drop marked the fourth consecutive month in 2018 to post single-digit percent declines, rather than the double-digit monthly drops consistently seen in early 2018 and over the previous three years.
 
“It varies by market, but we’re hearing that buyers are being more selective and sellers are becoming more pragmatic,” said RE/MAX CEO Adam Contos. “That dynamic could bring inventory levels up, especially in the most overheated markets, where we expect to see the clearest signs of equilibrium returning. The economy is strong and potential buyers are out there—they just need more listings, at the right price points, to consider. We believe that balance will return, which will be good for everyone in the long run. It’s just a matter of when.” 
 
Contos added that although the lack of inventory continues to be a challenge, the trends suggest that the market finally appears to be rebalancing.
 
“The moderation we are experiencing seems to be a bit more than the normal seasonal lull we’d expect this time of year,” said Contos.
 
Closed Transactions 
Of the 54 metro areas surveyed in August 2018, the overall average number of home sales is down 0.4% compared to July 2018, and decreased 1.1% compared to August 2017. Twenty-two of the 54 metro areas experienced increases in sales year-over-year including, Houston, TX, +34.2%, Burlington, VT, +11.5%, New Orleans, LA, +10.7% and Tulsa, OK, 10.5%.
 
Median Sales Price – Median of 54 metro median prices
In August 2018, the median of all 54 metro Median Sales Prices was $248,500, down 0.7% from July 2018 and up 3.7% from August 2017. Only four metro areas saw year-over-year decreases in Median Sales Prices including Trenton, NJ, at -1.9%, Little Rock, AR, at -1.1%, Burlington, VT, at -0.3% and Birmingham, AL, at
-0.03%. Three metro areas increased year-over-year by double-digit percentages, with the largest increases seen in Boise, ID, +16.8%, San Francisco, CA, +11.7% and Augusta, ME, +10.2%.  
 
Days on Market – Average of 54 metro areas
The average Days on Market for homes sold in August 2018 was 43, up two days from the average in July 2018, and down 4 days from the August 2017 average. The metro areas with the lowest Days on Market were Omaha, NE, at 21, Seattle, WA, at 23, and San Francisco, CA, Denver, CO, and Cincinnati, OH, all tied with 25. The highest Days on Market averages were in Augusta, ME, at 91, Miami, FL, at 78, Hartford, CT at 77 and New York, NY, at 65. Days on Market is the number of days between when a home is first listed in an MLS and a sales contract is signed.
 
Months Supply of Inventory – Average of 54 metro areas
The number of homes for sale in August 2018 was down 1.0% from July 2018 and down 5.4% from August 2017. Based on the rate of home sales in August, the Months Supply of Inventory increased to 3.0 from 2.9 in July 2018, and decreased compared to August 2017 at 3.1. A 6.0-months supply indicates a market balanced equally between buyers and sellers. In August 2018, all but one, Miami, FL, of 54 metro areas surveyed reported a months supply at or less than 6.0, which is typically considered a seller’s market. The markets with the lowest Months Supply of Inventory are San Francisco, CA, at 1.4, Boise, ID, at 1.6, Denver, CO, at 1.7 and Salt Lake City, UT, at 1.8


Feel free to contact me and I can help break down exactly what these numbers mean for our local market and for your neighborhood. And lastly, If you or anyone you know is thinking of buying or selling a home - please call or email me. I'm here to help!


Peter Veres

Associate Broker,CRS,ABR,CLHMS,SRES

Elite Asset Management Team - RE/MAX Elite

www.PeteVeres.com

Cell: 505-362-2005


Office: 505-798-1000


Feel free to contact me and I can help break down exactly what these numbers mean for our local market and for your neighborhood. And lastly, If you or anyone you know is thinking of buying or selling a home - please call or email me. I'm here to help!


Peter Veres

Associate Broker,CRS,ABR,CLHMS,SRES

Elite Asset Management Team - RE/MAX Elite

www.PeteVeres.com

Cell: 505-362-2005

Office: 505-798-1000


15th Annual Studio Tour

by Elite Asset Management Team

15th Annual Studio Tour September 15 &16, 2018

10:00am – 5:00pm


SANDIA HEIGHTS STUFF THE TRUCK EVENT

by Elite Asset Management Team

Note: This event will be Saturday October 20th 8:30am to 11:30am, correction...not PM.


July 2018 RE/MAX National Housing Report

by Elite Asset Management Team

Sales Increase Nearly 2%, Despite Record Prices, Sinking Inventory


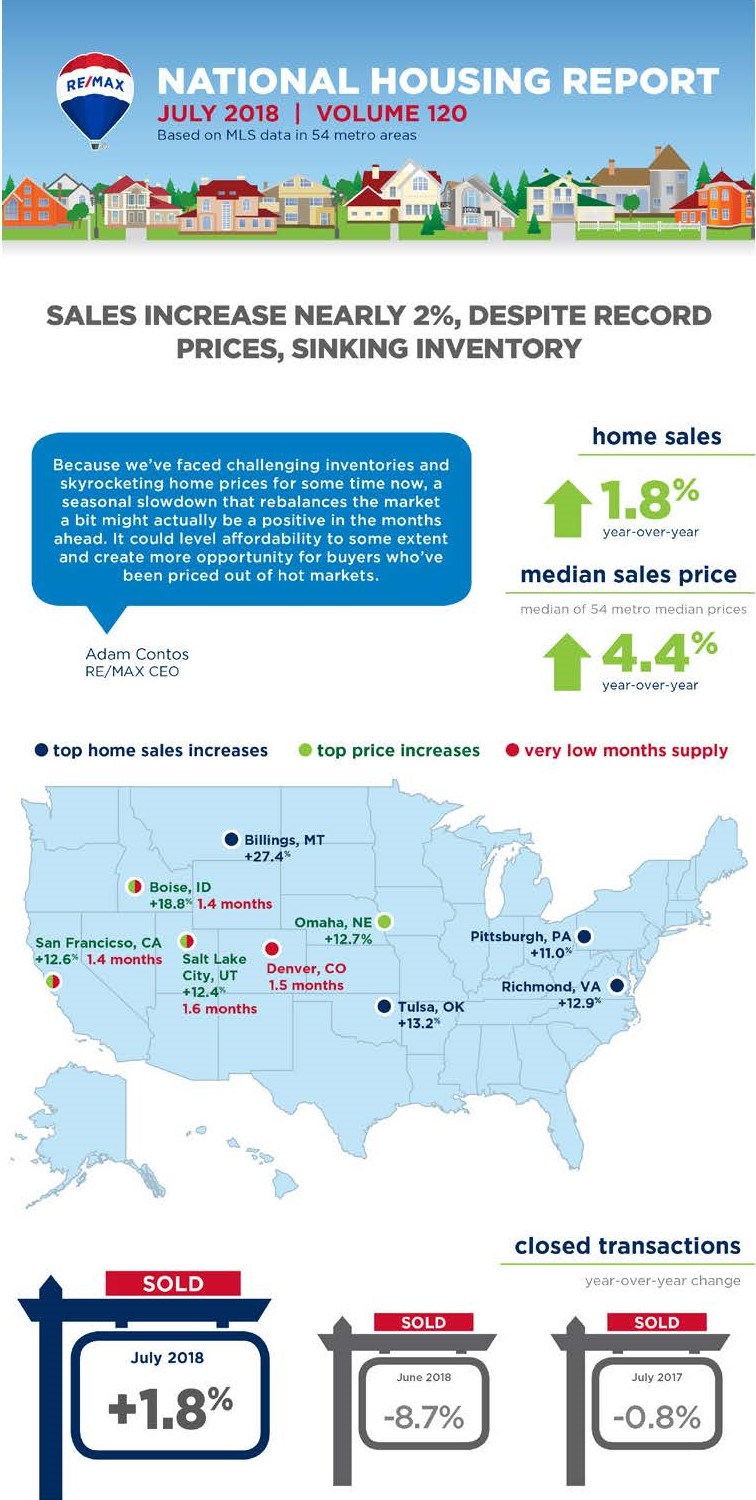
DENVER – July home sales rose 1.8% year-over-year, making it the second month of 2018 to post a sales increase year-over-year, according to the RE/MAX National Housing Report.

In the July 2018 report, 37 of the report’s 54 metro areas posted sales increases over July 2017—April was the first month of 2018 where more homes were sold than the same month in 2017. The report also marks the 28th consecutive month of year-over-year price increases.
 
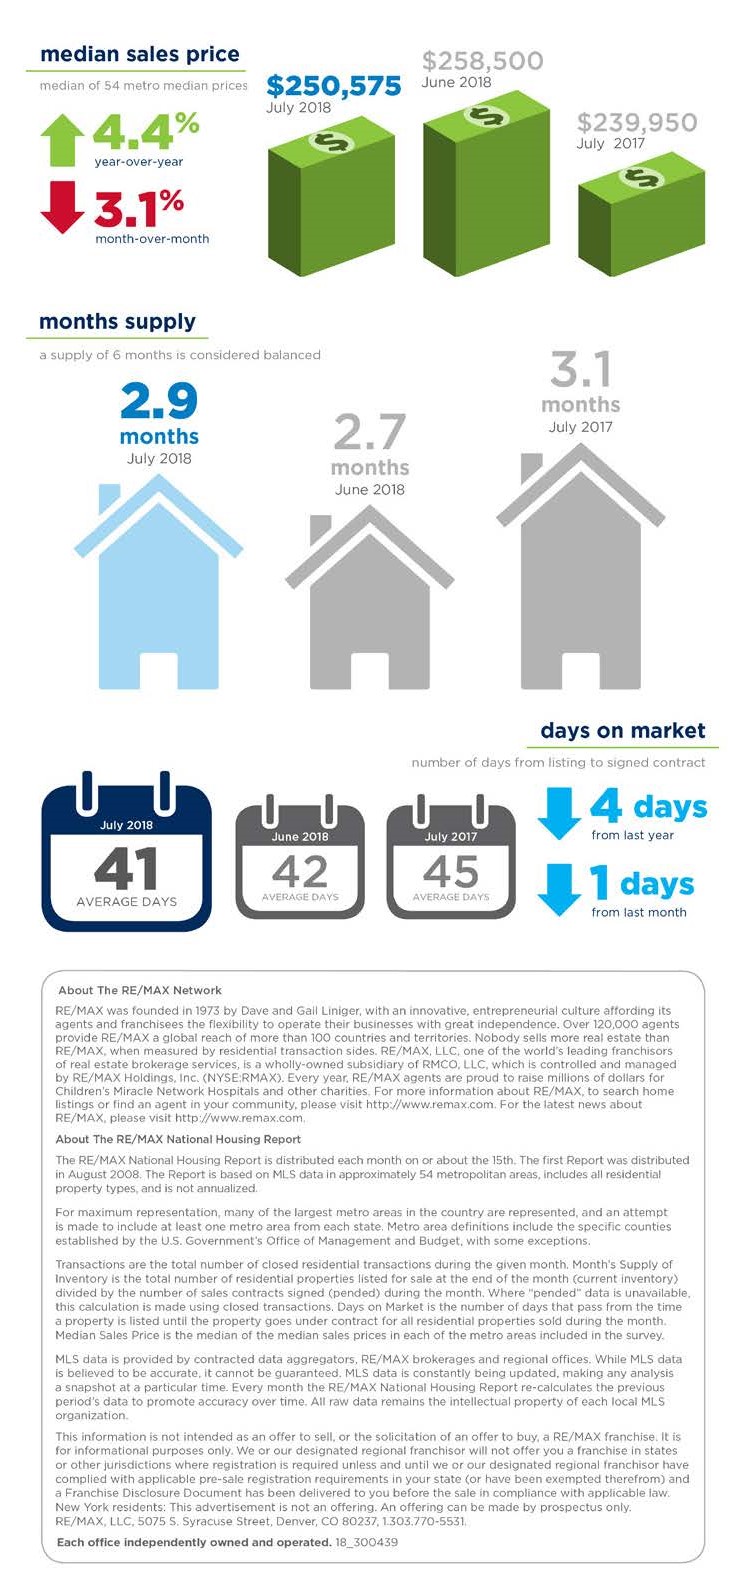
The Median Sales Price of $250,575 was up 4.4% from July 2017, and represents the third-highest price in report history—topped only by May and June of this year. Months Supply of Inventory was at 2.9 – the smallest total ever recorded for July.
 
Forty-two of the 54 metro areas reported a year-over-year drop in inventory. The Days on Market dropped to 41 – four days less than July 2017 and one day under the previous nine-year low set in June 2018.
 
“Because we’ve faced challenging inventories and increasing home prices for some time now, a seasonal slowdown that rebalances the market a bit might actually be a positive in the months ahead,” said RE/MAX CEO Adam Contos. “It could level affordability to some extent and create more opportunity for buyers who’ve been priced out of hot markets.”

Closed Transactions 
Of the 54 metro areas surveyed in July 2018, the overall average number of home sales was down 8.7% compared to June 2018, yet increased 1.8% compared to July 2017. Thirty-seven of the 54 metro areas experienced an increase in sales year-over-year, including Billings, MT, +27.4%, Tulsa, OK, +13.2%, Richmond, VA, +12.9% and Pittsburgh, PA, +11%.   
 
Median Sales Price – Median of 54 metro median prices
In July 2018, the median of all 54 metro Median Sales Prices was $250,575, down 3.1% from June 2018 and up 4.4% from July 2017. Only four metro areas saw a year-over-year decrease in Median Sales Price, including Wilmington/Dover, DE, -2.2% and Trenton, NJ, -0.7%. Four metro areas increased year-over-year by double-digit percentages, with the largest increases seen in Boise, ID, +18.8%, Omaha, NE, +12.7%, San Francisco, CA, +12.6% and Salt Lake City, UT, +12.4%. 
 
Days on Market – Average of 54 metro areas
The average Days on Market for homes sold in July 2018 was 41, down one day from the average in June 2018, and down 4 days from the July 2017 average. The metro areas with the lowest Days on Market were Seattle, WA, at 19, Omaha, NE, at 20, and Denver, CO and San Francisco, CA tied at 22. The highest Days on Market averages were in Augusta, ME, at 89, Miami, FL, at 83, Hartford, CT at 76 and New York, NY, at 65. Days on Market is the number of days between when a home is first listed in an MLS and a sales contract is signed.
 
Months Supply of Inventory – Average of 54 metro areas
The number of homes for sale in July 2018 was down 0.3% from June 2018, and down 7.8% from July 2017. Based on the rate of home sales in July, the Months Supply of Inventory increased to 2.9 from 2.7 in June 2018, and decreased from 3.1 in July 2017. A 6.0-months supply indicates a market balanced equally between buyers and sellers. In July 2018, all but one of 54 metro areas surveyed reported a months supply at or less than 6.0, which is typically considered a seller’s market. The markets with the lowest Months Supply of Inventory are San Francisco, CA, and Boise, ID, tied at 1.4, Denver, CO, at 1.5 and Salt Lake City, UT, at 1.6.  

Feel free to contact me and I can help break down exactly what these numbers mean for our local market and for your neighborhood. And lastly, If you or anyone you know is thinking of buying or selling a home - please call or email me. I'm here to help!

Peter Veres
Associate Broker,CRS,ABR,CLHMS,SRES
Elite Asset Management Team - RE/MAX Elite
www.PeteVeres.com
Cell: 505-362-2005
Office: 505-798-1000

Feel free to contact me and I can help break down exactly what these numbers mean for our local market and for your neighborhood. And lastly, If you or anyone you know is thinking of buying or selling a home - please call or email me. I'm here to help!


Peter Veres

Associate Broker,CRS,ABR,CLHMS,SRES

Elite Asset Management Team - RE/MAX Elite

www.PeteVeres.com

Cell: 505-362-2005

Office: 505-798-1000

Home Sales Low This Summer

by Elite Asset Management Team


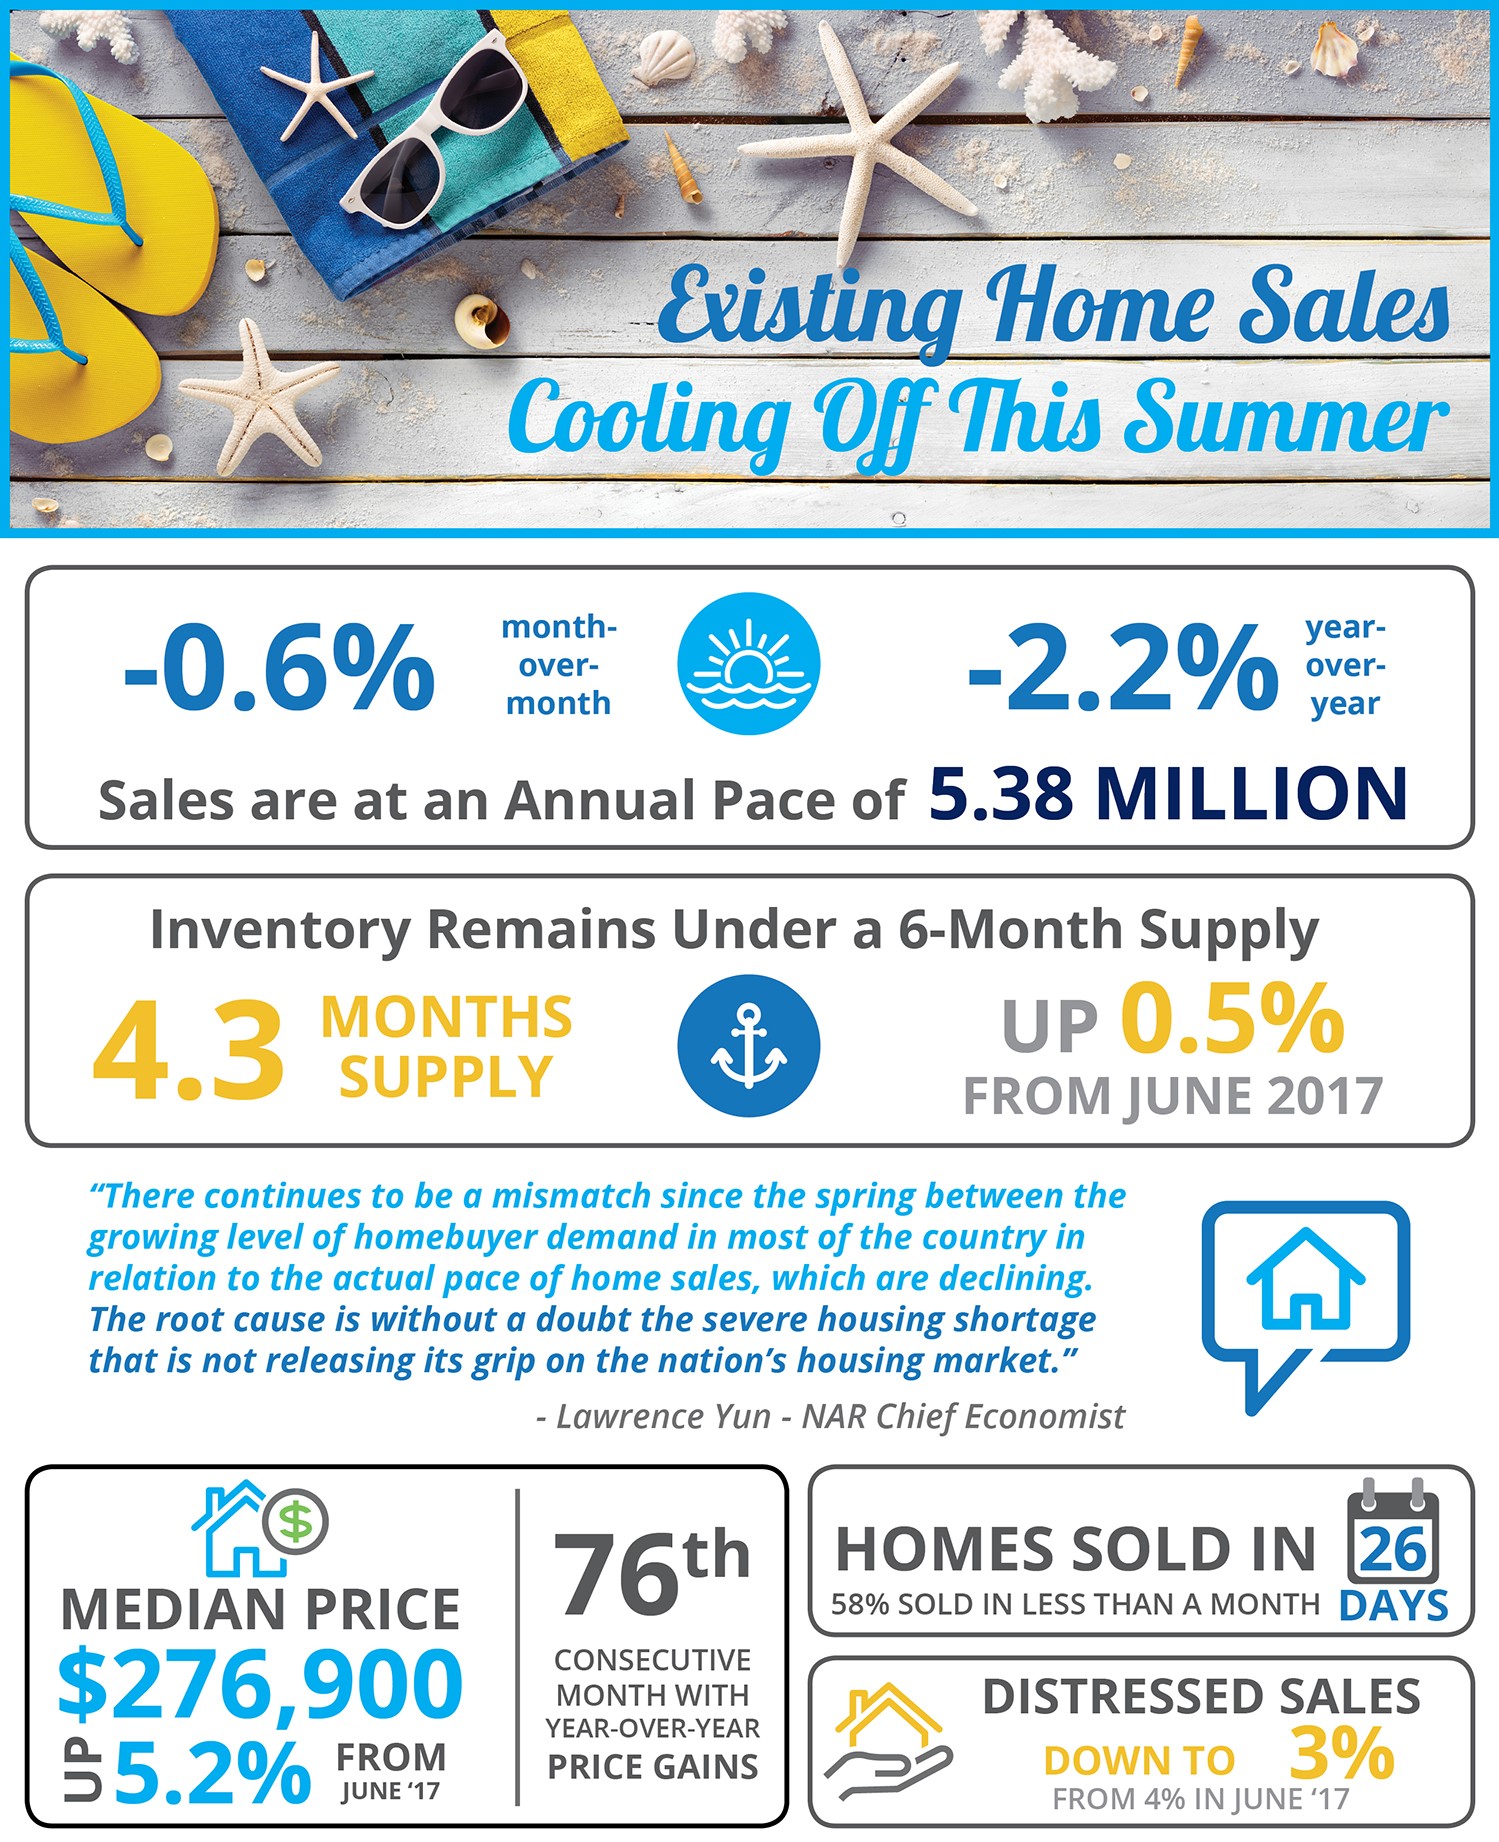
Sales in June down 2.2% from last year, according to the National Association of Realtors’ latest Existing Home Sales Report.

Home inventory still below 6-month supply needed for a normal market despite the 0.5% improvement from last year.

NAR’s Chief Economist Lawrence Yun had this to say: “There continues to be a mismatch since the spring between the growing level of homebuyer demand in most of the country in relation to the actual pace of home sales, which are declining. The root cause is without a doubt the severe housing shortage that is not releasing its grip on the nation’s housing market.”


In our local Albuquerque Market the median sales price is $208,000, up +4.1% from last year this time and months supply is 2.5, down -37% from last year

Meet with a realtor like Pete Veres, CRS – Certified Residential Specialist & ABR – Accredited Buyers and Seller Representative who can help you navigate thru the process and get the job done for you. He can provide you with a Free Market analysis when you are ready. Pete Veres has had over 25 years of Sales & Marketing experience, excellent negotiating skills and a superb track record.

You can contact him by calling or texting him at 505-362-2005 or by emailing him at [email protected].

He has a great website full of the latest information at www.NMElite.com

Here are also some Free Sellers resources. VIP-Seller-Resources

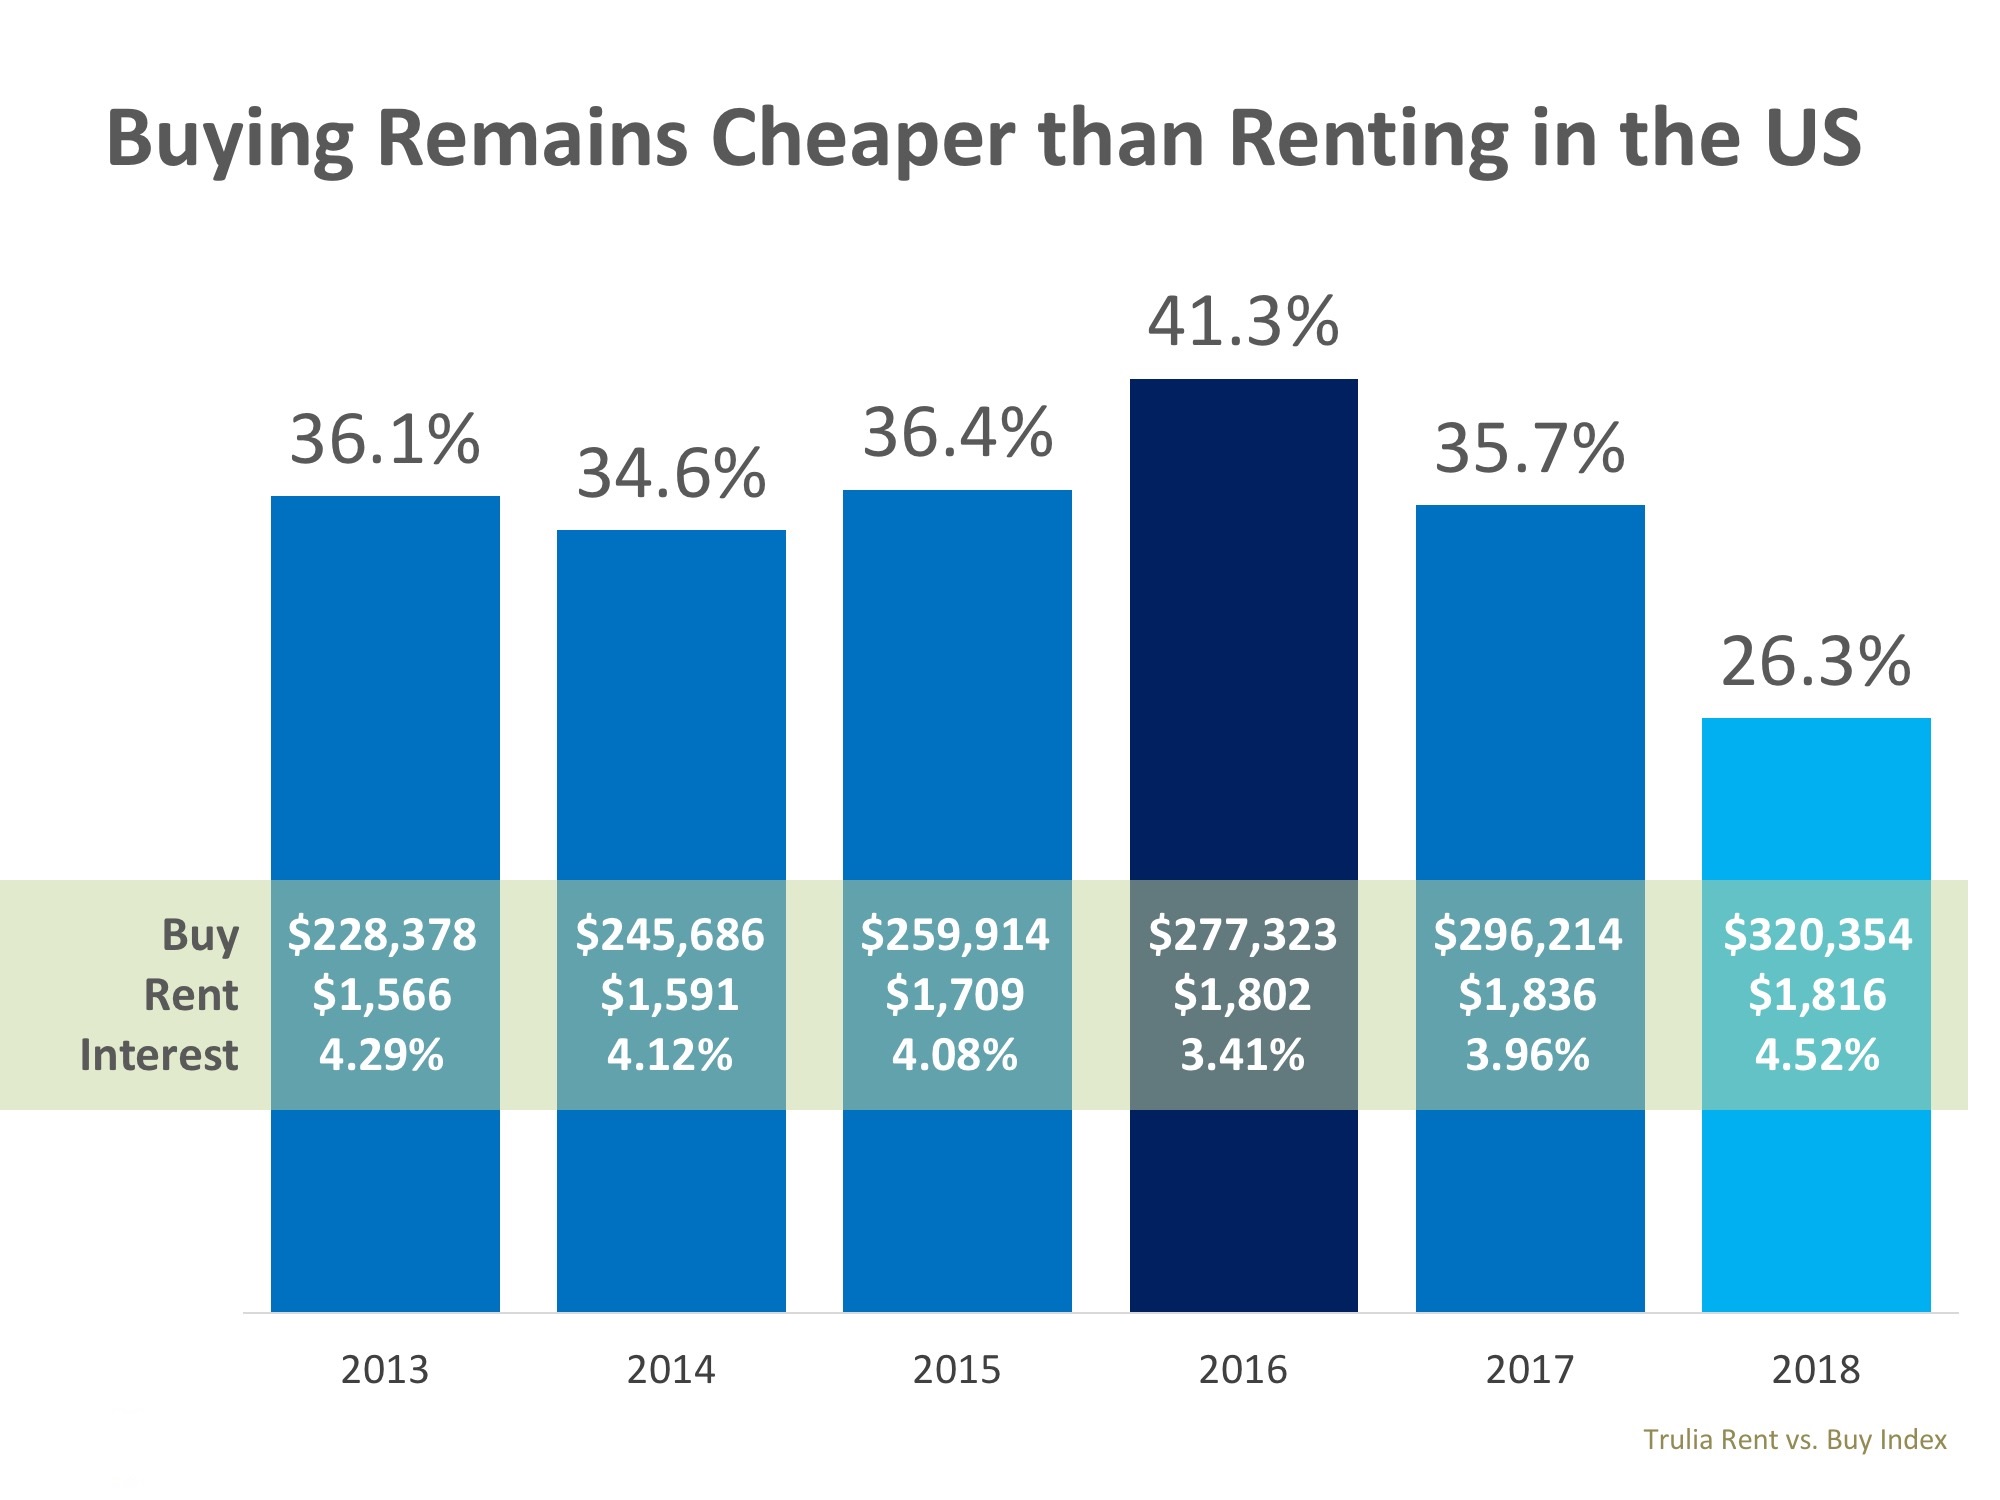
It Is Now Cheaper To Buy Than To Rent By 26.3%!

by Elite Asset Management Team


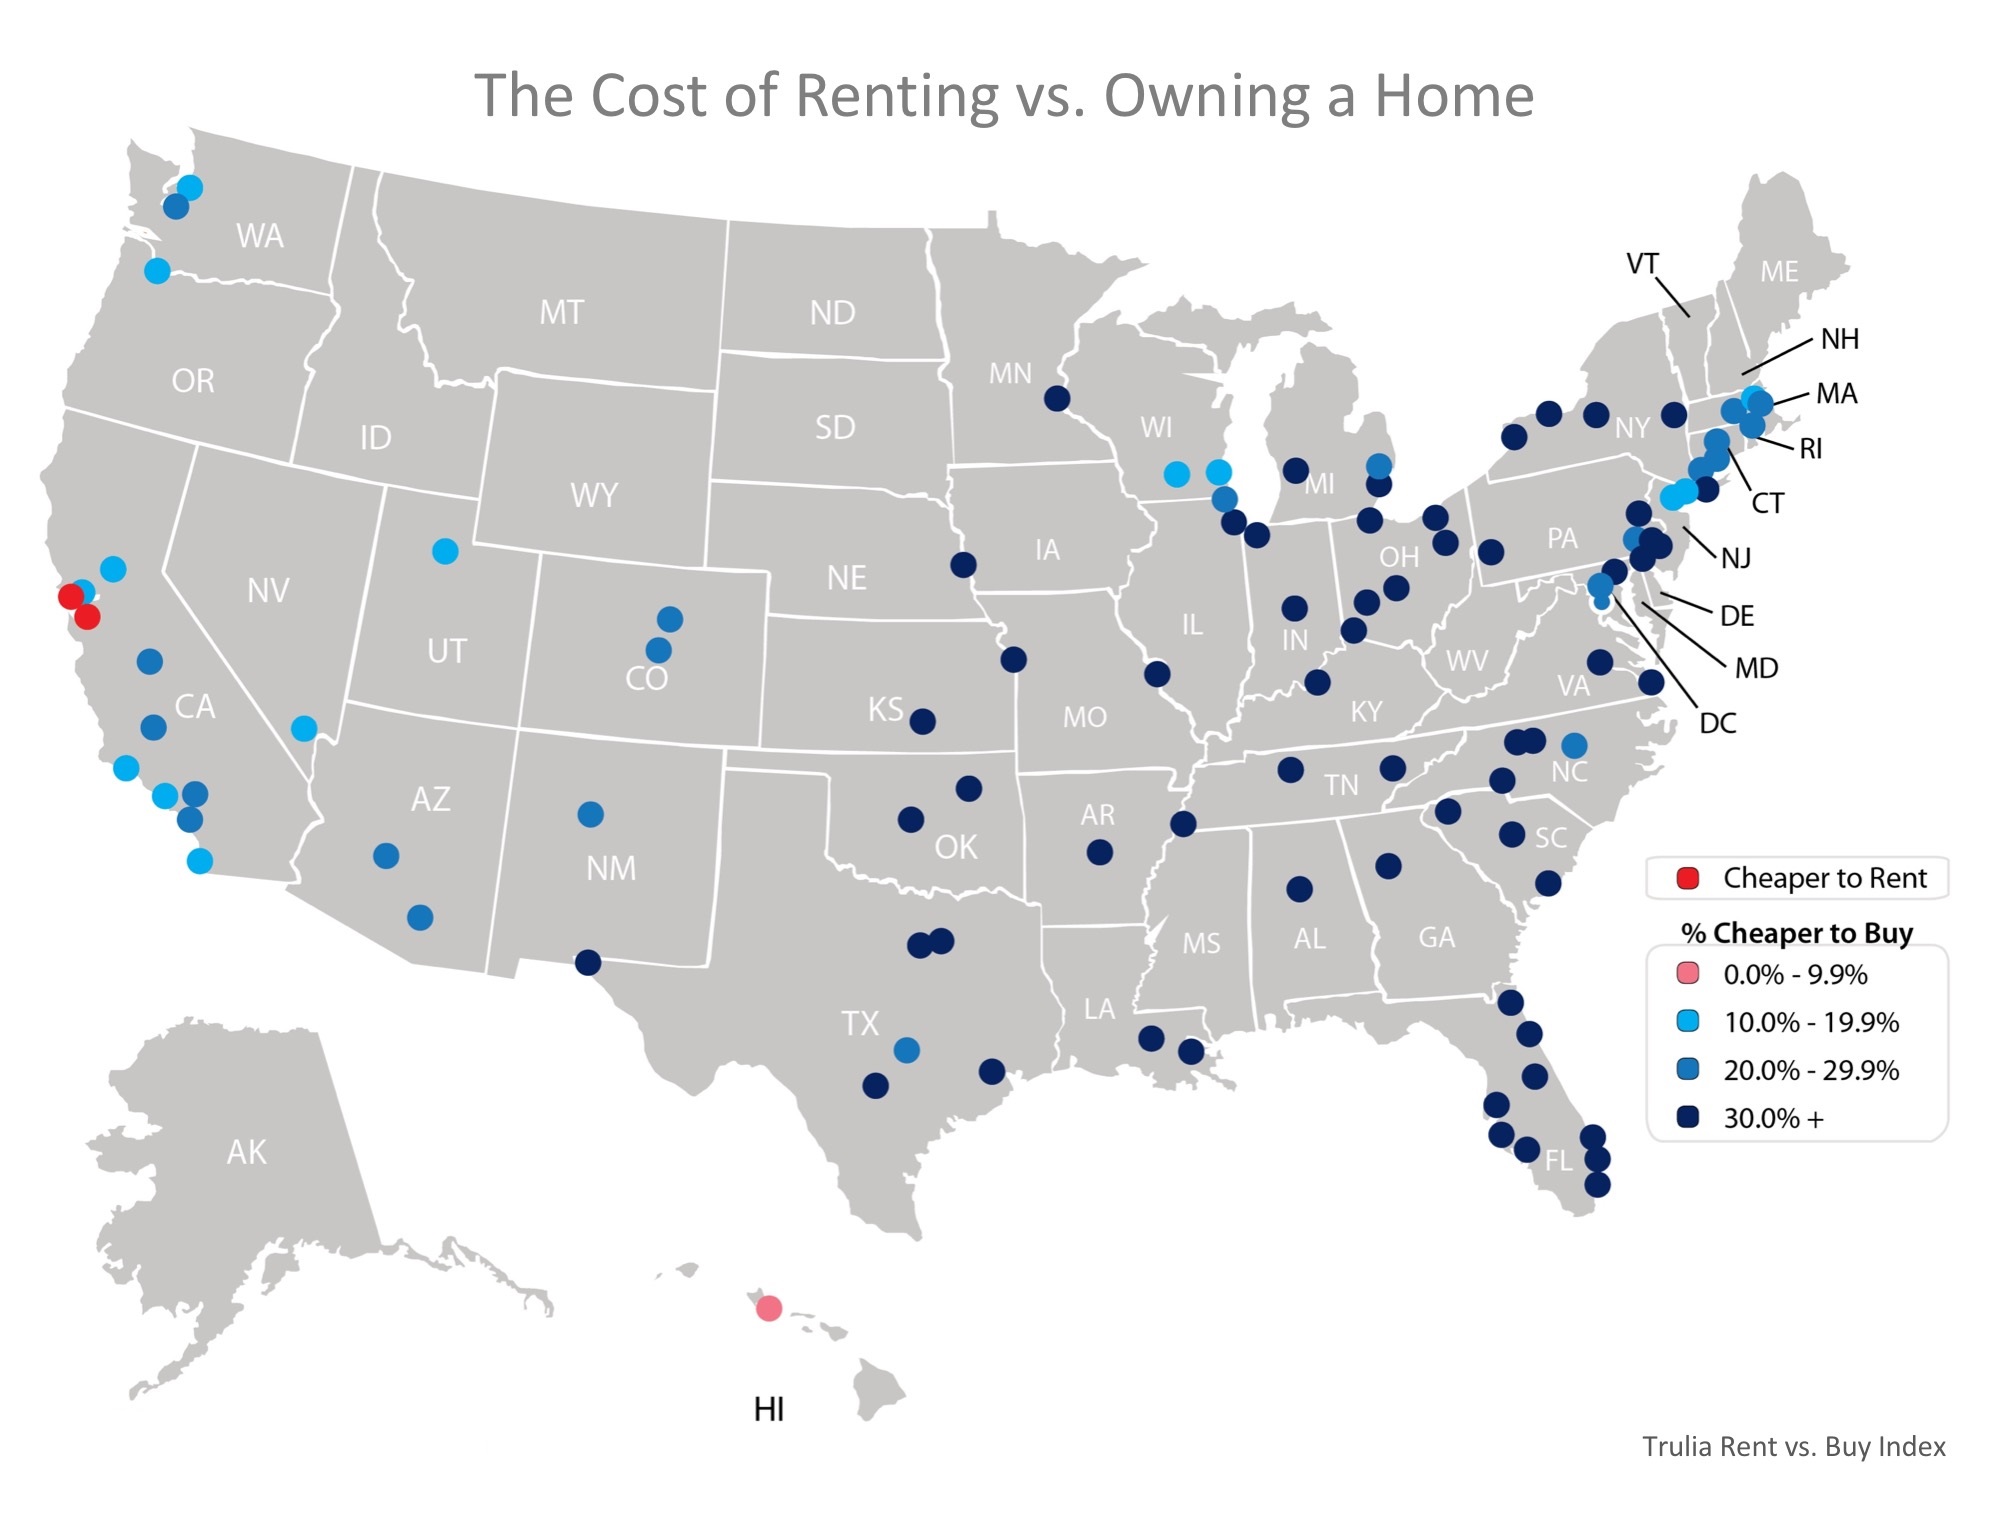
In 98 of the 100 largest metro areas in the United States, it is cheaper to buy than to rent with a 30-year fixed rate mortgage, according to a recent report done by Trulia.

This report is the Rent vs Buy report. The 97 of the 98 metro areas are on a double digit advantage when it comes to how cheap it is to buy vs rent.

The map below shows the metro areas that were studies and how cheap it is to buy rather than rent. The darker the blue, the cheaper it is.

Here’s how Trulia calculates the true cost of rent vs buying.

Trulia includes all assumed renting costs, including one-time costs (like security deposits), and compares them to the monthly costs of owning a home (insurance, mortgage payments, taxes, and maintenance) including one-time costs (down payments, closing costs, sale proceeds). They also assume that households stay in their home for seven years, put down a 20% down payment, and take out a 30-year fixed rate mortgage.

Six year study chart:

It shows the impact of the median home price, rental price, and 30-year fixed rate interest rate used to calculate the ‘cheaper to buy’ metric.


The average mortgage rate back in 2016 was the driving force for making it 41.3% cheaper to buy a home. Rates have been the highest in six years but buying a home remains cheaper.


Cheryl Young, Trulia’s Chief Economist, had this to say,

“One point deserves emphasizing: The ultra-costly San Francisco Bay Area is not a harbinger for the nation as a whole. While renting may outweigh buying in San Jose and San Francisco, it is unlikely that renting will tip the scales nationally anytime soon.”

Aside from being cheaper than renting, owning your own home has a lot of advantages. Home values are always rising and you wouldn’t want to miss out on equity.

Meet with a realtor like Pete Veres, CRS – Certified Residential Specialist & ABR – Accredited Buyers Representative who can help you navigate thru the process and get the job done for you. Pete Veres has had over 25 years of Sales & Marketing experience, excellent negotiating skills and a superb track record.

You can contact him by calling or texting him at 505-362-2005 or by emailing him at [email protected].

He has a great website full of the latest information at www.NMElite.com
 

June 2018 RE/MAX National Housing Report

by Elite Asset Management Team

Median Sales Price Reaches Nine-Year High, While Sales Decline


July 18, 2018
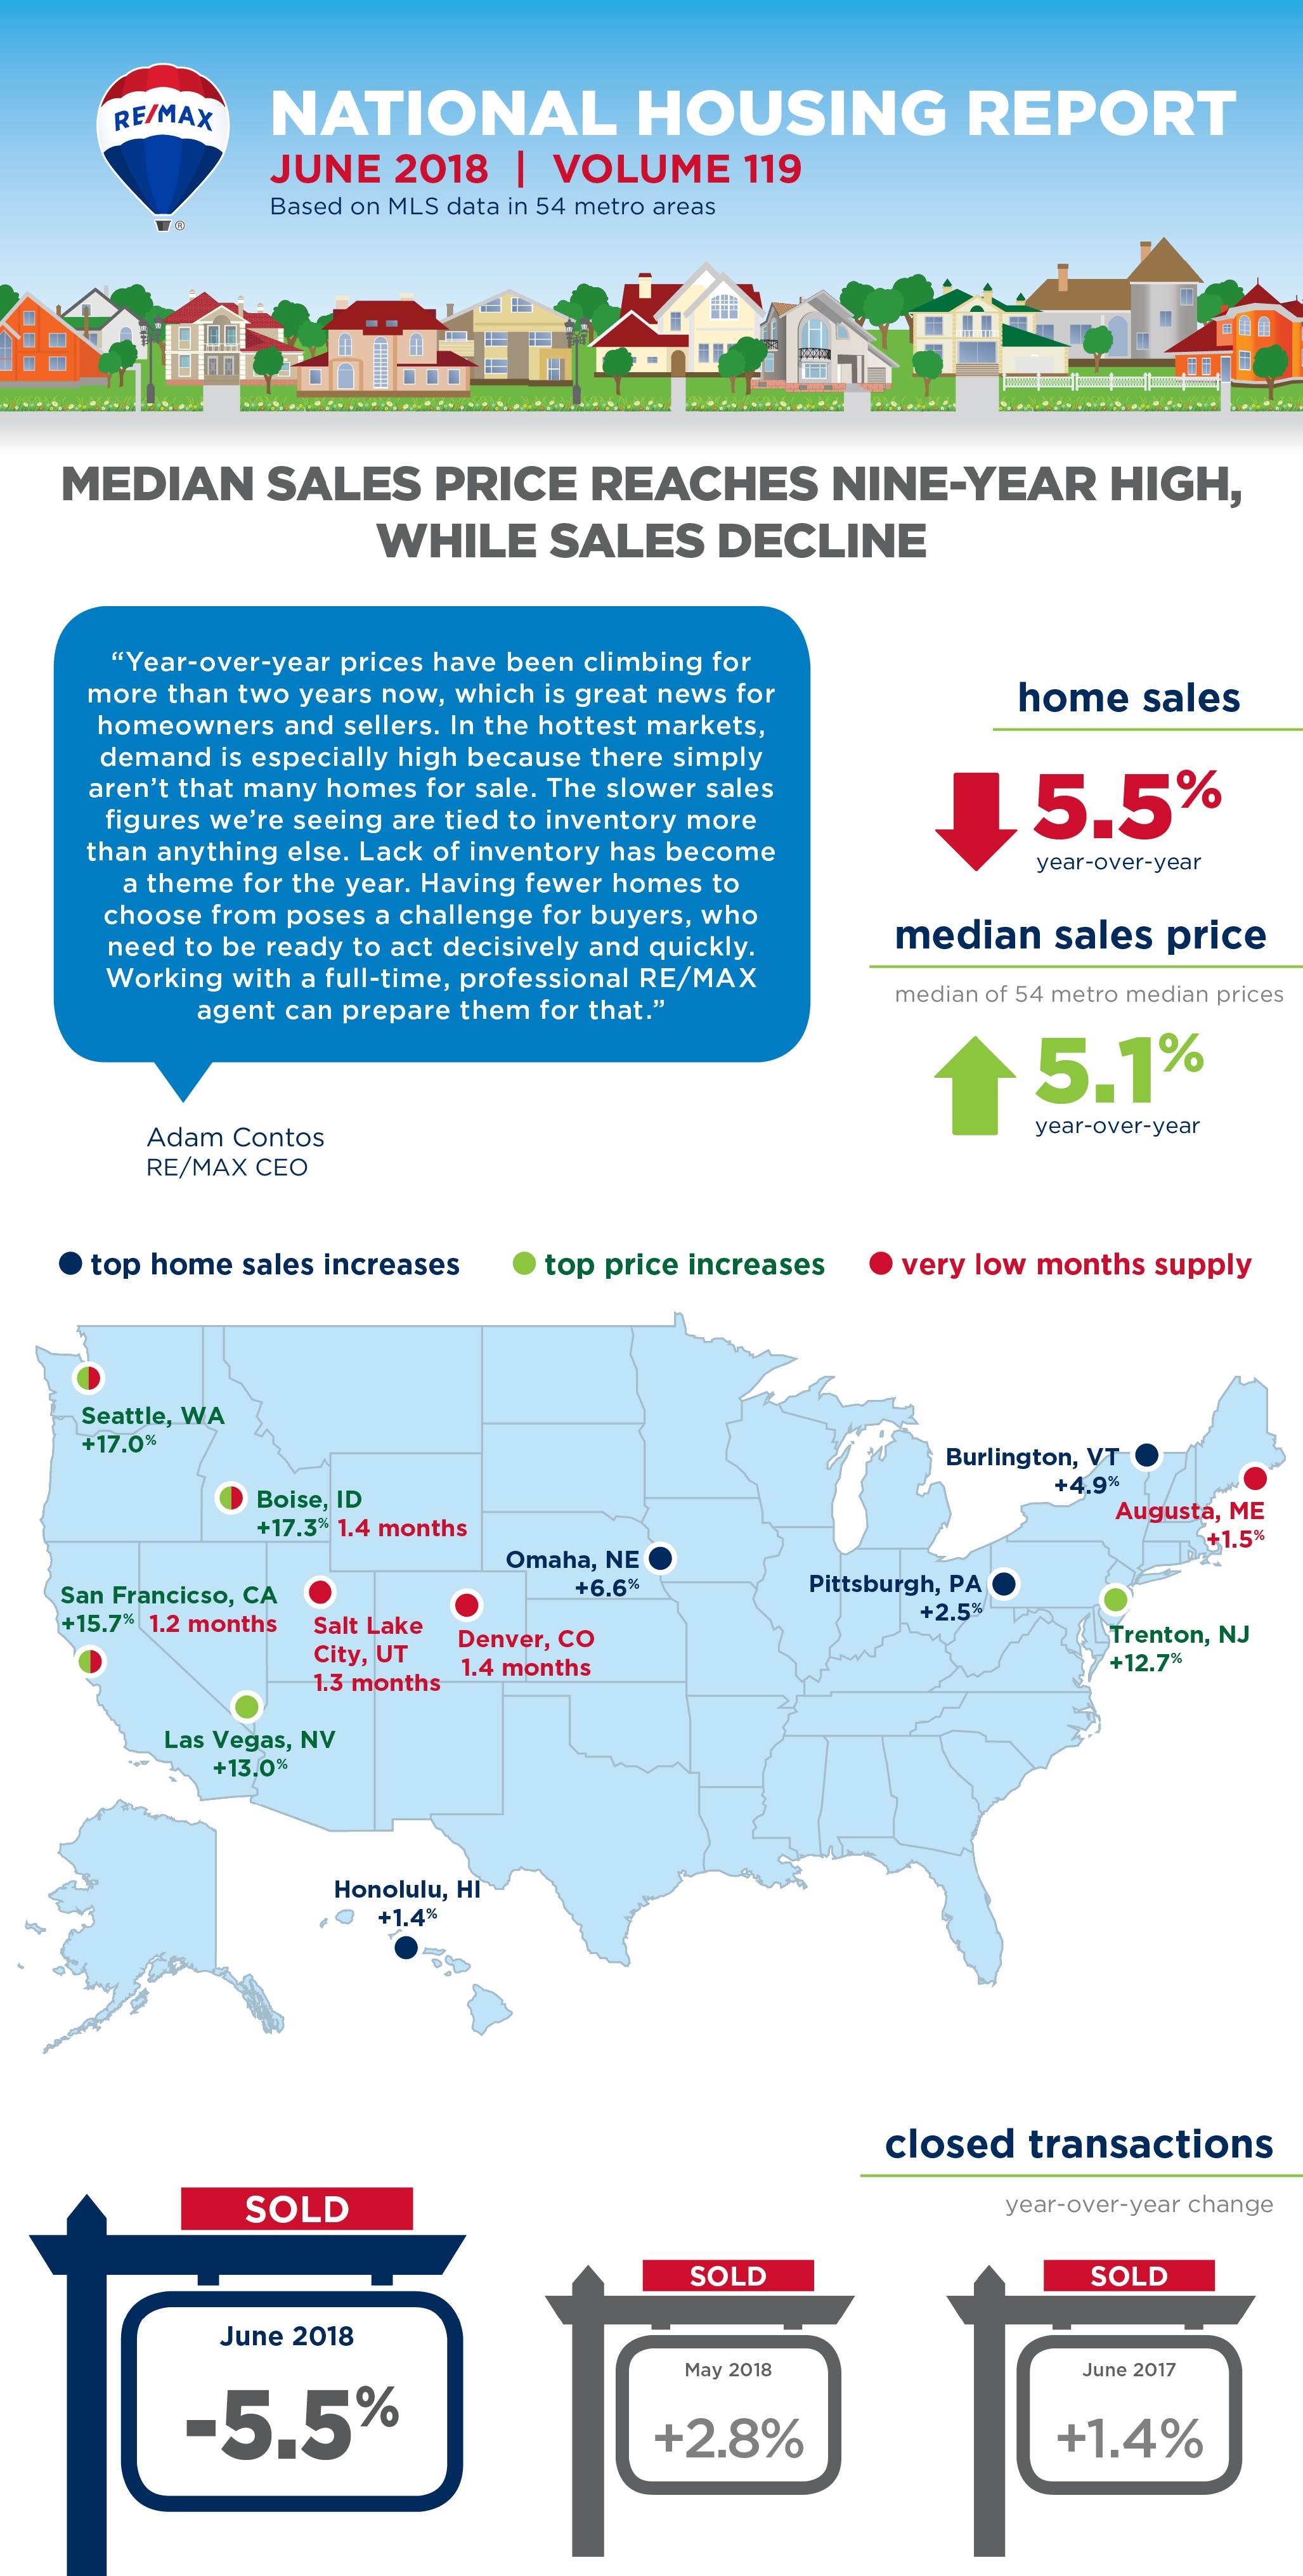
DENVER – Halfway through 2018, prices are at record highs, inventory is at record lows and home sales are trailing 2017’s pace, according to the RE/MAX National Housing Report.
 
June sales were 5.5% lower than June 2017 in the 54 metro areas surveyed, marking the seventh consecutive month of year-over-year declines.
 
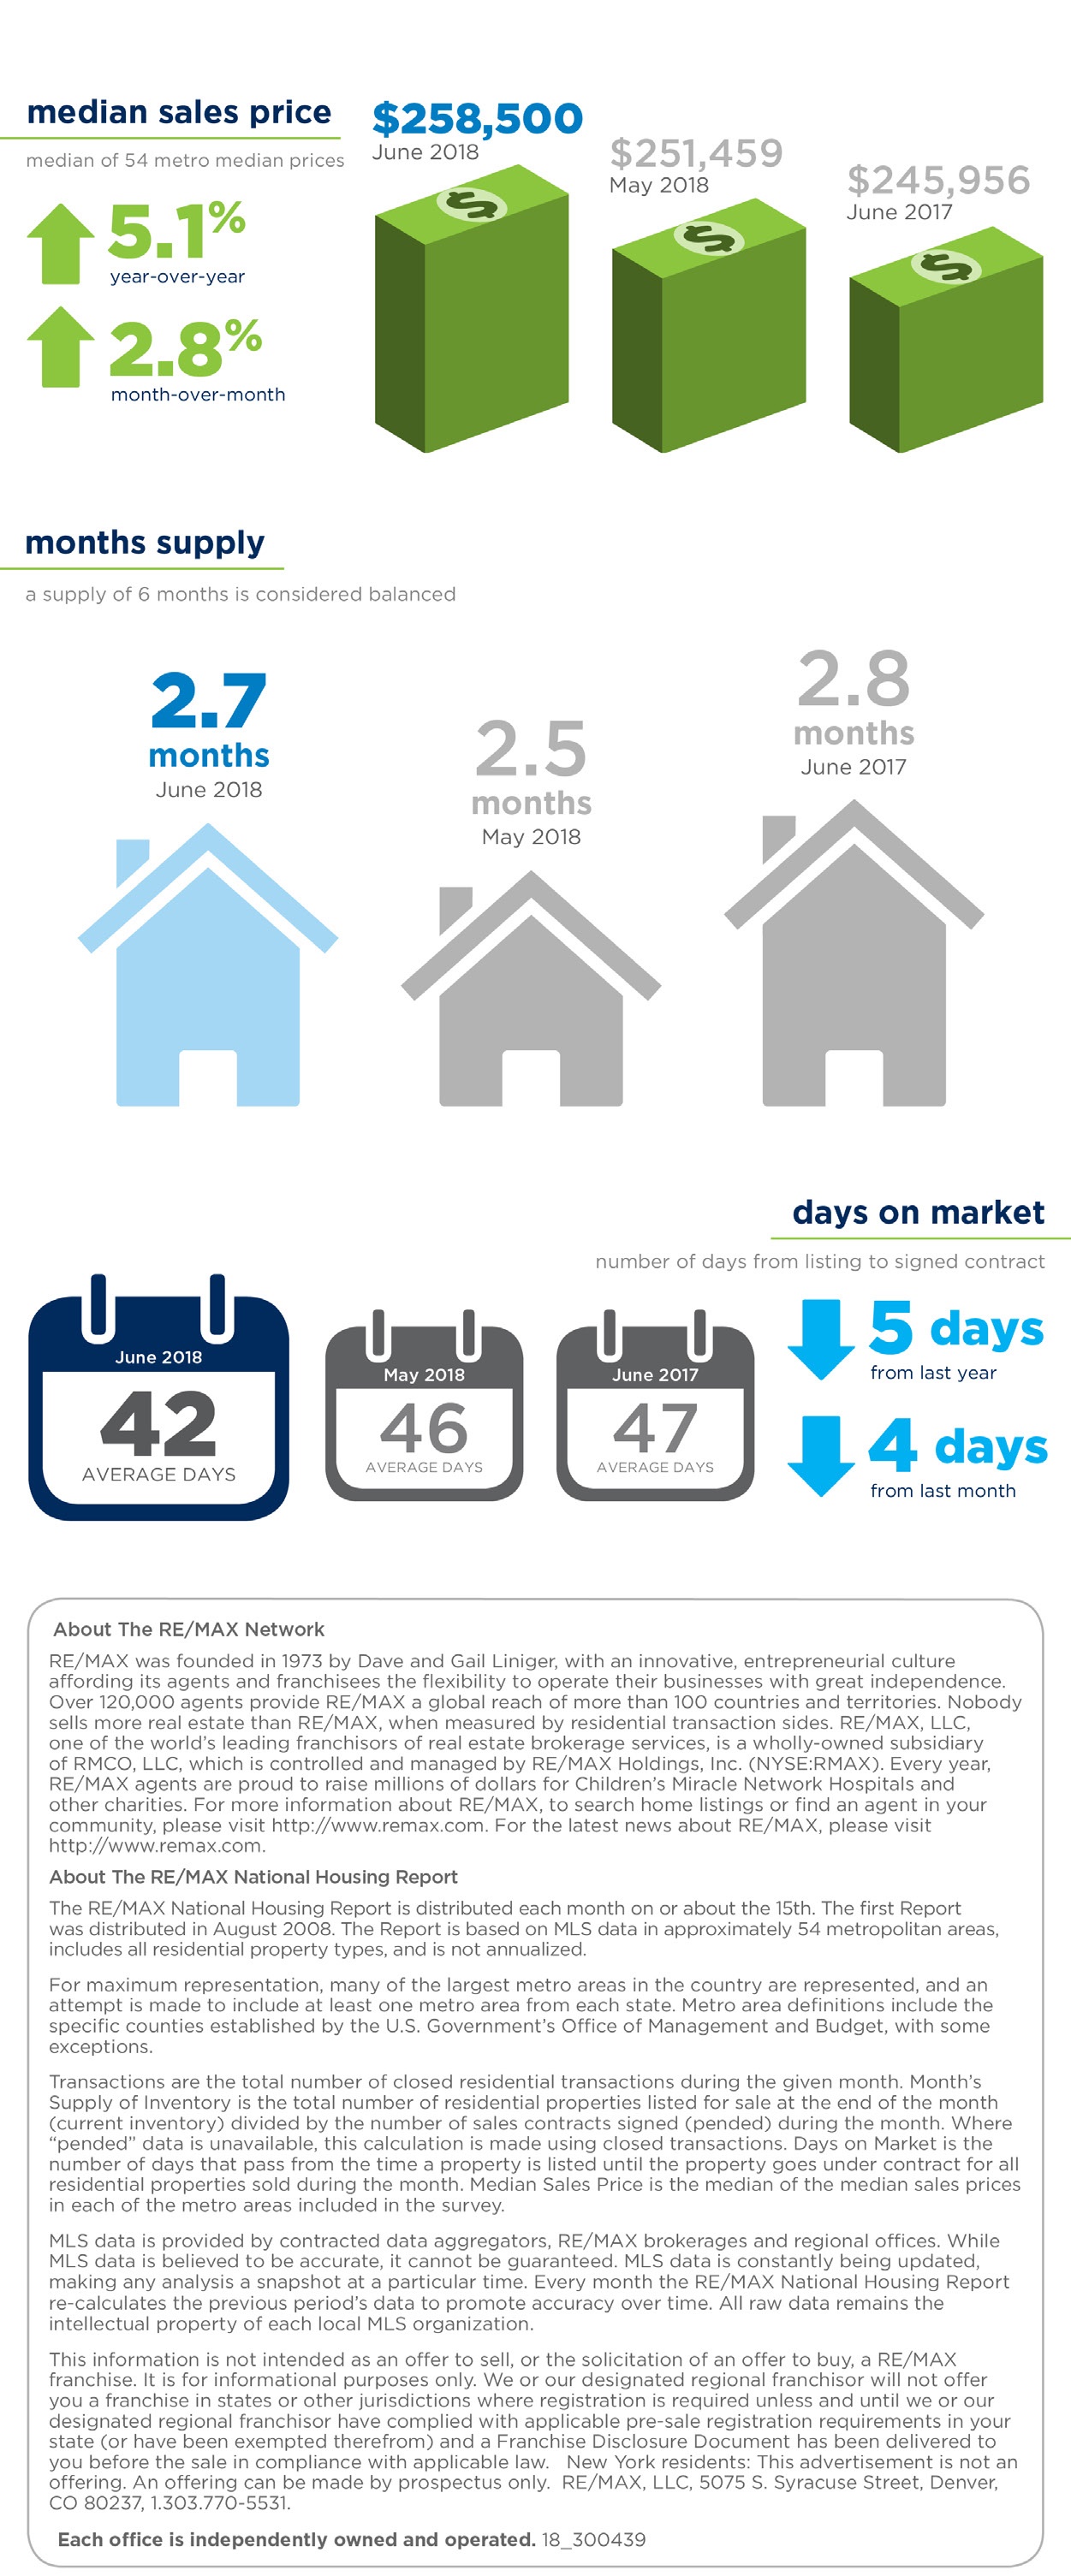
Headed in the opposite direction, the June Median Sales Price of $258,500 was an all-time high in the nine-year history of the report. It was 5.1% higher than the $245,000 recorded last June, bringing the consecutive months of year-over-year price increases to 27. In each of the previous five years – going back to June 2013’s $193,750 – June has posted the highest Median Sales Price of the year.
 
“Year-over-year prices have been climbing for more than two years now, which is great news for homeowners and sellers,” said RE/MAX CEO Adam Contos. “In the hottest markets, demand is especially high because there simply aren’t that many homes for sale. The slower sales figures we’re seeing are tied to inventory more than anything else.”
 
Forty-two of the 54 metro areas reported a year-over-year drop in inventory. That years-long trend is reflected in Months Supply of Inventory dropping to 2.7 – down 8.8% year-over-year and the smallest figure ever recorded for June. Fewer houses for sale generally results in a faster process: Homes sold in June averaged just 42 Days on Market – five days less than June 2017 and three days under the previous nine-year low of 45 days (July 2017).
 
“Lack of inventory has become a theme for the year,” Contos said. “Having fewer homes to choose from poses a challenge for buyers, who need to be ready to act decisively and quickly. Working with a full-time, professional RE/MAX agent can prepare them for that.”
 
Closed Transactions 
Of the 54 metro areas surveyed in June 2018, the overall average number of home sales increased 5.4% compared to May 2018 and decreased 5.5% compared to June 2017. Seven of the 54 metro areas experienced an increase in sales year-over-year including, Omaha, NE, +6.6%, Burlington, VT, +4.9%, Pittsburgh, PA, +2.5% and Augusta, ME, at +1.5%.   
 
Median Sales Price – Median of 54 metro median prices
In June 2018, the median of all 54 metro Median Sales Prices was $258,500, up 2.8% from May 2018 and up 5.1% from June 2017. Only two metro areas saw a year-over-year decrease in Median Sales Price including Billings, MT, -0.6% and Anchorage, AK at -0.4%. Five metro areas increased year-over-year by double-digit percentages, with the largest increases seen in Boise, ID, +17.3%, San Francisco, CA, +15.7%, Las Vegas, NV, +13%, and Trenton, NJ at +12.7%.
 
Days on Market – Average of 54 metro areas
The average Days on Market for homes sold in June 2018 was 42, down four days from the average in May 2018, and down 5 days from the June 2017 average. The metro areas with the lowest Days on Market were Seattle, WA at 17, San Francisco, CA at 20, Denver, CO, at 21 and Omaha, NE at 22. The highest Days on Market averages were in Augusta, ME, at 97, Miami, FL, at 76, Hartford, CT at 73 and New York, NY, at 72. Days on Market is the number of days between when a home is first listed in an MLS and a sales contract is signed.
 
Months Supply of Inventory – Average of 54 metro areas
The number of homes for sale in June 2018 was up 2.5% from May 2018, and down 8.8% from June 2017. Based on the rate of home sales in June, the Months Supply of Inventory increased to 2.7 from 2.5 in May 2018, and decreased compared to June 2017 at 2.8. A 6.0-months supply indicates a market balanced equally between buyers and sellers. In June 2018, all but one of 54 metro areas surveyed reported a months supply at or less than 6.0, which is typically considered a seller’s market. The markets with the lowest Months Supply of Inventory are in the west with San Francisco, CA, at 1.2, Salt Lake City, UT, 1.3, and Boise, ID and Denver, CO, both tied with 1.4.  

Feel free to contact me and I can help break down exactly what these numbers mean for our local market and for your neighborhood. And lastly, If you or anyone you know is thinking of buying or selling a home - please call or email me. I'm here to help!

Peter Veres

Associate Broker,CRS,ABR,CLHMS,SRES

Elite Asset Management Team - RE/MAX Elite

www.PeteVeres.com

Cell: 505-362-2005

Office: 505-798-1000


Displaying blog entries 81-90 of 240

Syndication

Categories

Archives

Contact Information

Photo of Elite Asset Management  Real Estate
Elite Asset Management
RE/MAX SELECT
8300 Carmel Ave. NE Ste. 203
Albuquerque NM 87122
(505)362-2005

zillow reviews